This report contains a list of all employees who received on-the-job training and assessment.
Employees who have not completed sessions are not included in the report.
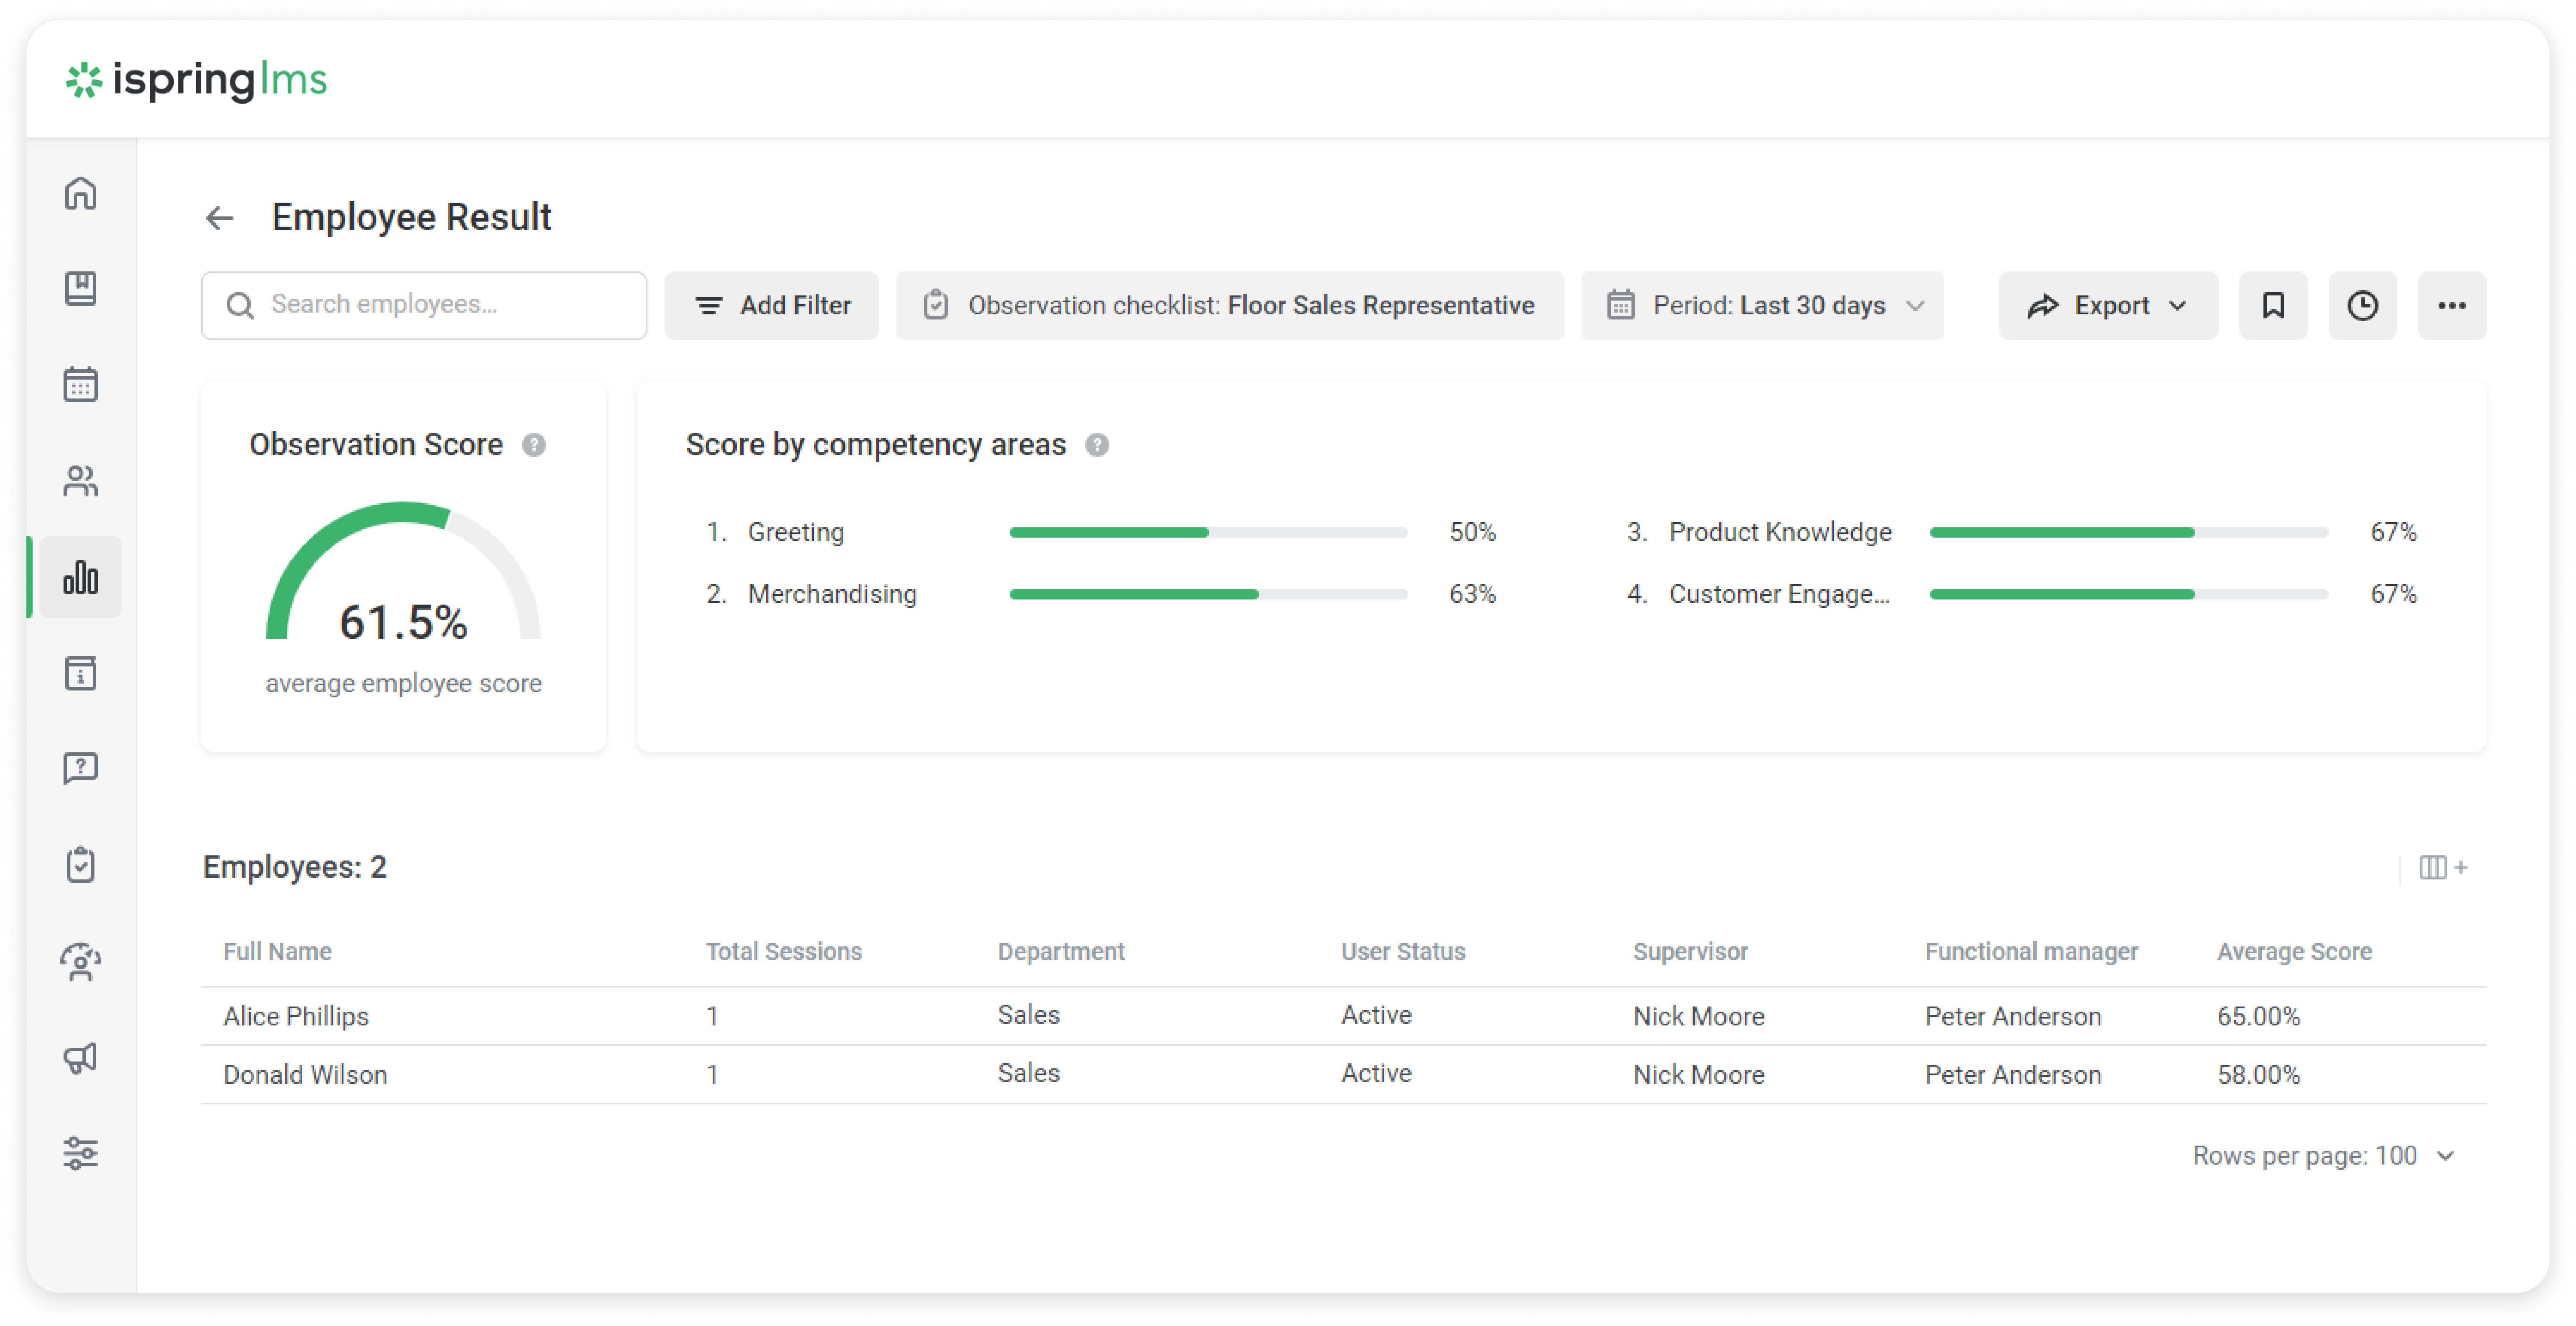
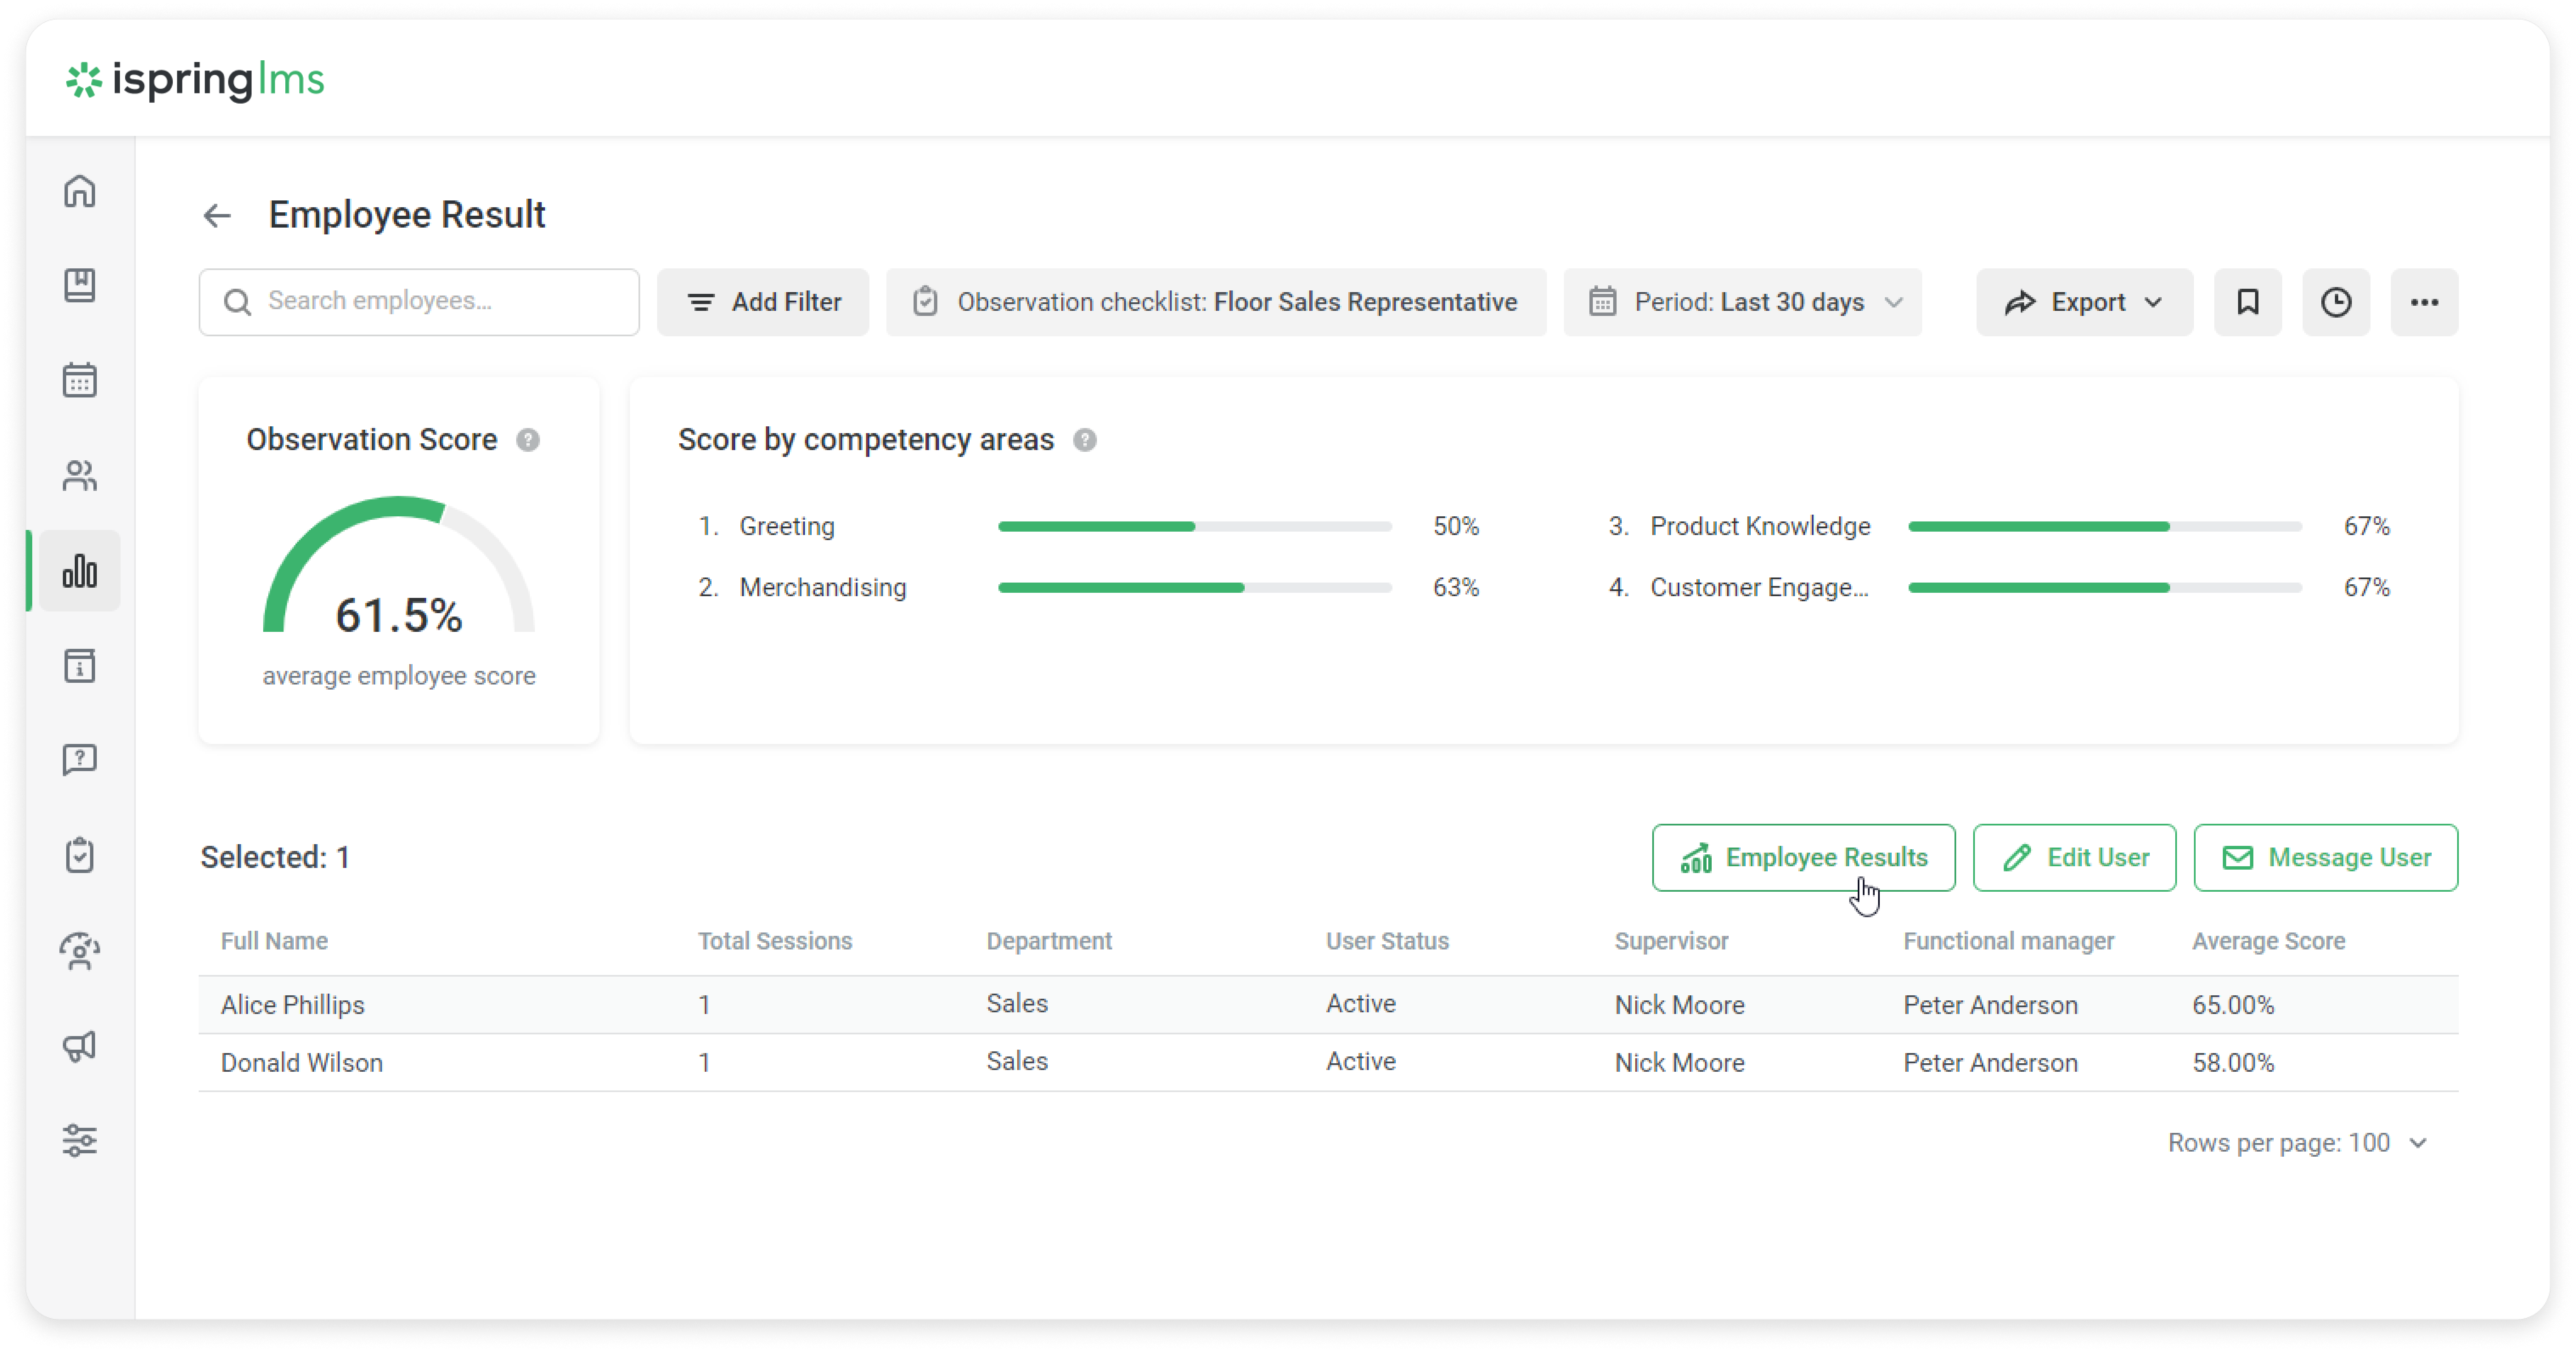
The summary will show the average result of all employees from the table and the results organized by criteria groups.
From the report, you can go to an employee's profile.
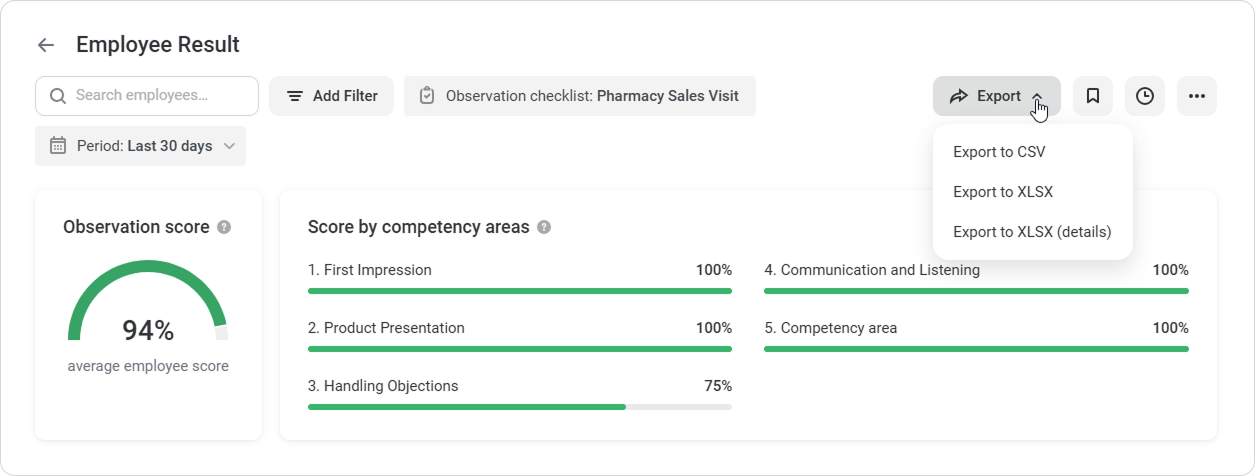
Report Export
You can export the report. Click Export at the top of the screen and select an option:
- CSV
- XLSX
- XLSX (details) — a detailed report with information about on-the-job training sessions and results for each observation checklist metric.
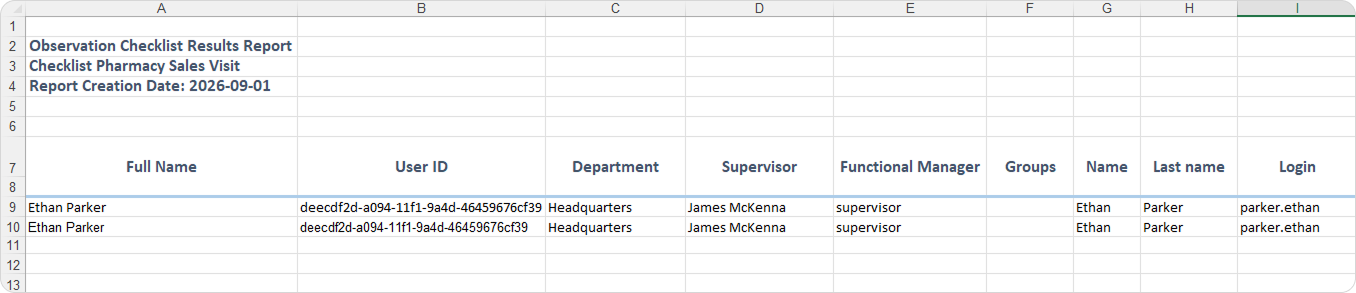
Detailed Report
The detailed report includes information about the employee and observer, session dates and status, feedback, the overall score, fields from the General Info section, and results for competency areas and individual metrics.
Each row represents one on-the-job training session. If a session includes multiple observations, the row shows the combined results for that session.
Results by Competency area
For each competency area, the report shows the overall result as a percentage. If a session includes multiple observations, the result is based on scores from all observations.
For example, two observations were conducted during one session. In the Product Presentation competency area, the employee received:
- Identified the client’s needs — 2 out of 2 points
- Connected product benefits to the client’s needs — 2 out of 2 points
- Explained the product’s key features — 1 out of 2 points
- Used clear arguments and examples — 2 out of 2 points
The overall result for the competency area is 7 out of 8 points, or 88%.

Results by Metric
The detailed report includes a separate Result column for each observation checklist metric.
If a metric was evaluated in multiple observations, you’ll see the total score for that metric across all observations.
For example, if the employee received 1 out of 1 point for Identified the client’s needs in each of two observations, the report will show 2 out of 2 points.
Previously, the Result column showed an answer from a single observation, such as Yes or No. Now, it shows the total score for the metric across all observations in the session.