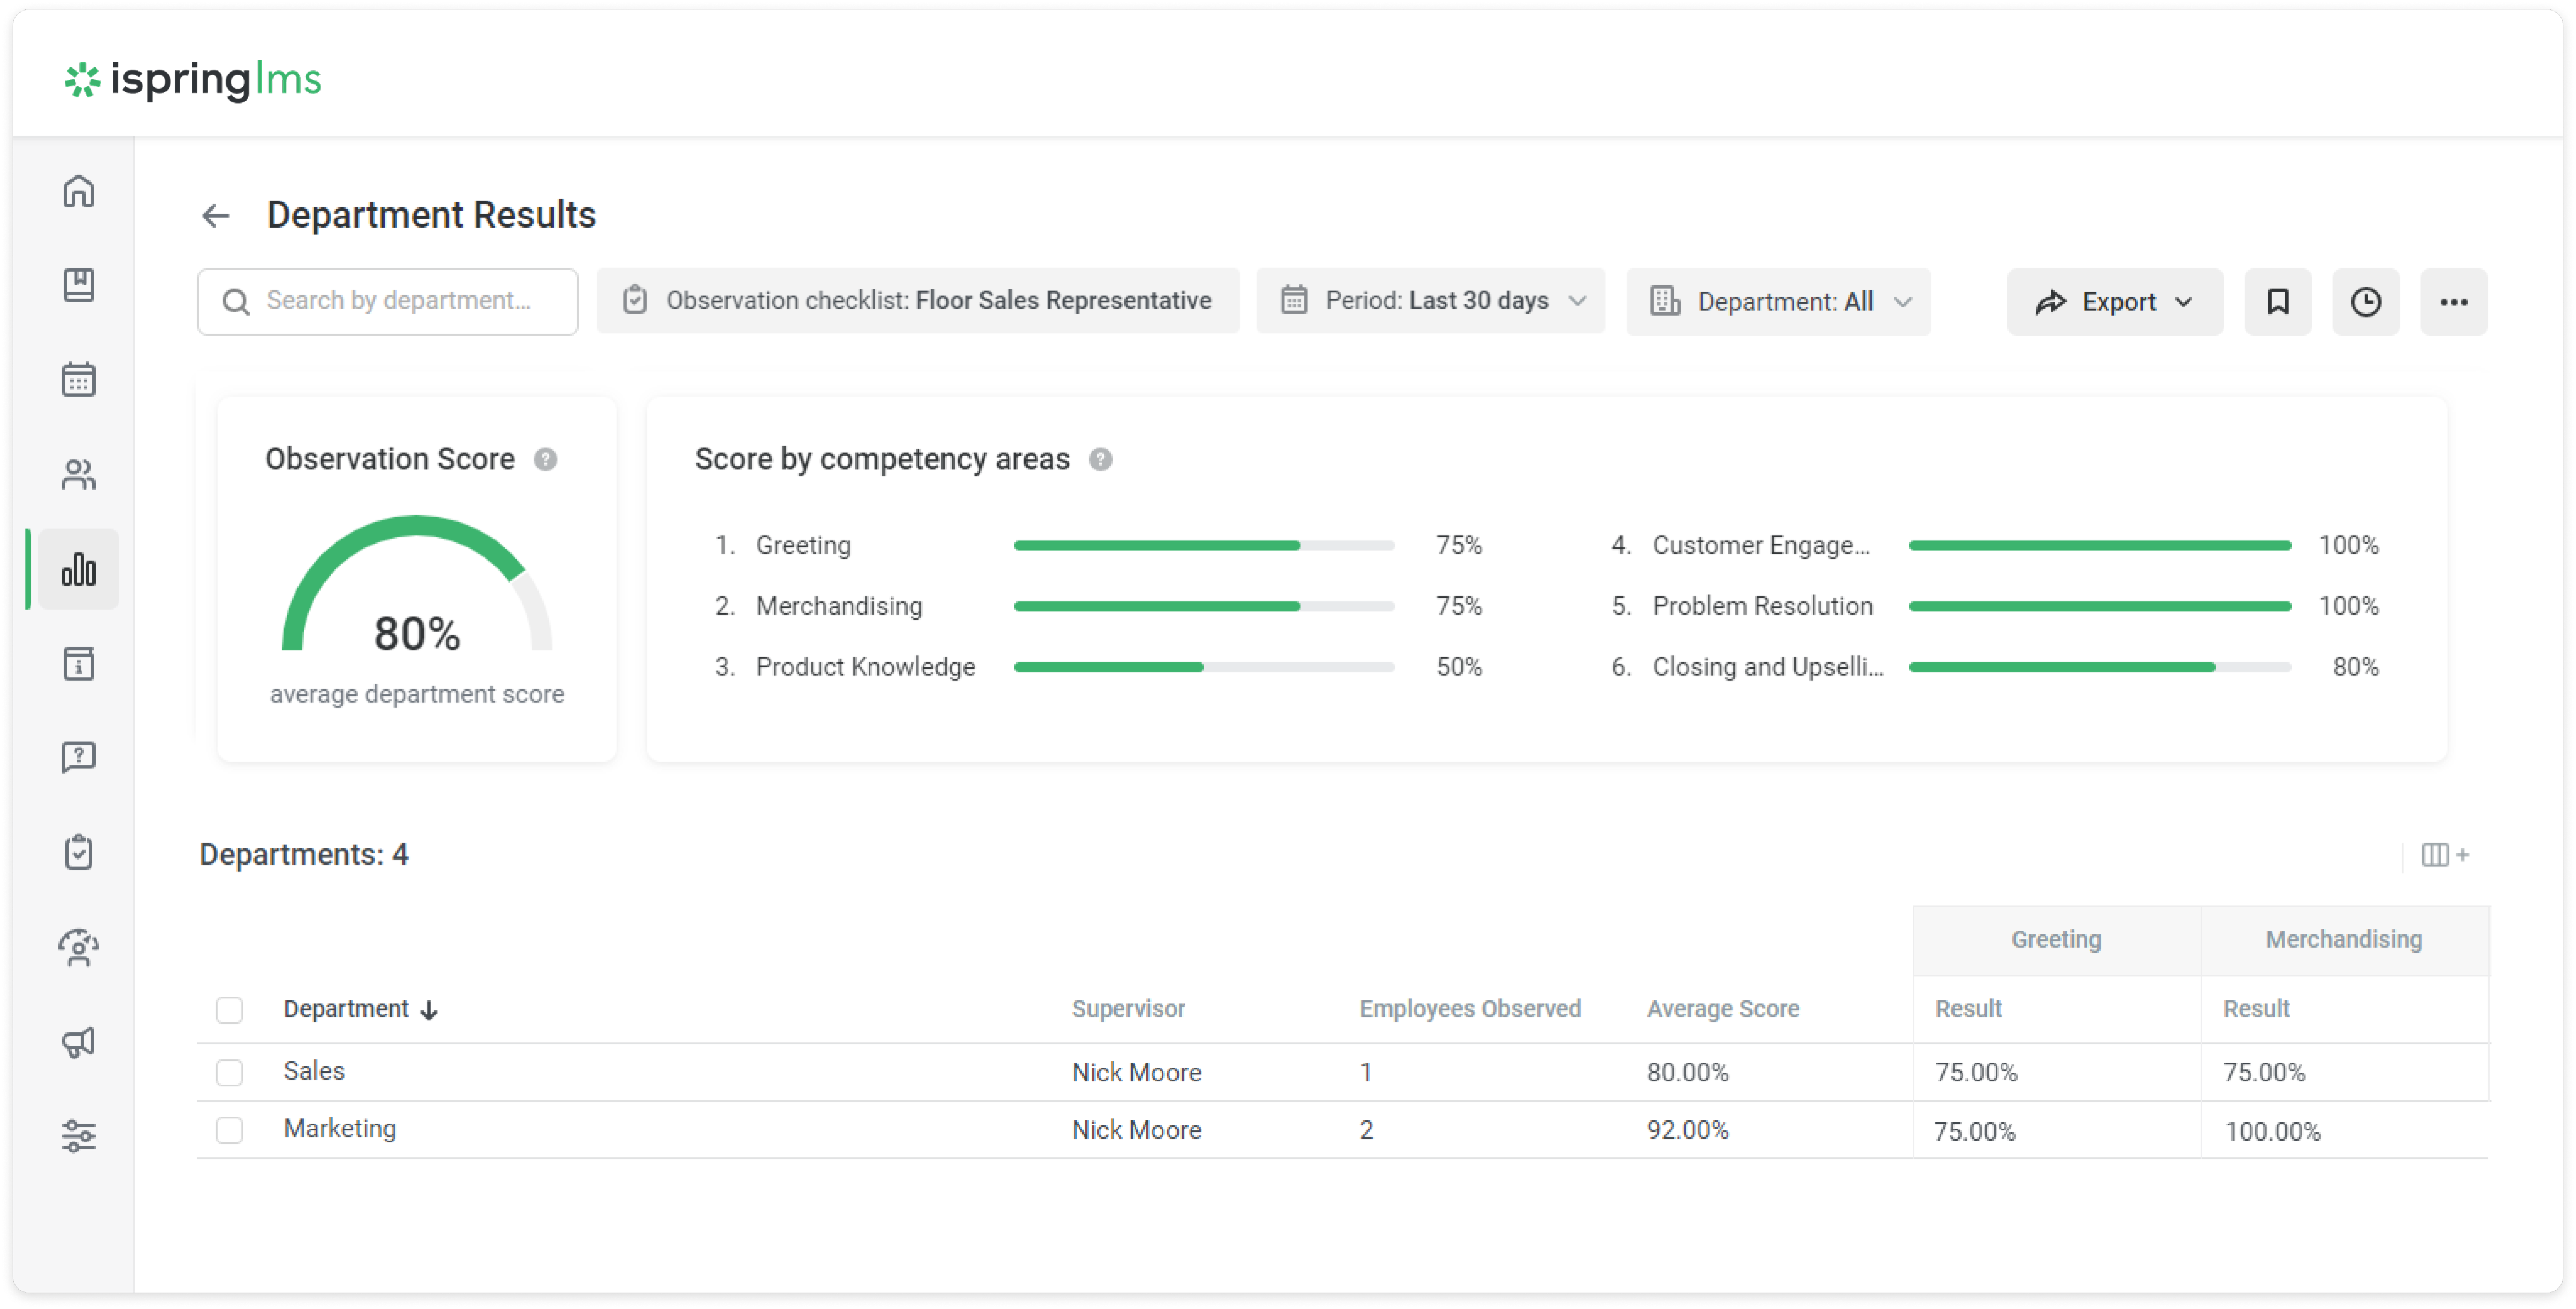
Here you’ll find the average results organized according to criteria groups and will be able to compare how departments meet the standards. In the report, you’ll see a list of all departments whose users have participated in on-the-job training.
The report consists of a summary and a table. In the summary, you’ll see the average result of all departments. The widget will show the average result of all departments by criteria groups.
Departments that don’t have completed sessions are not included in the report.
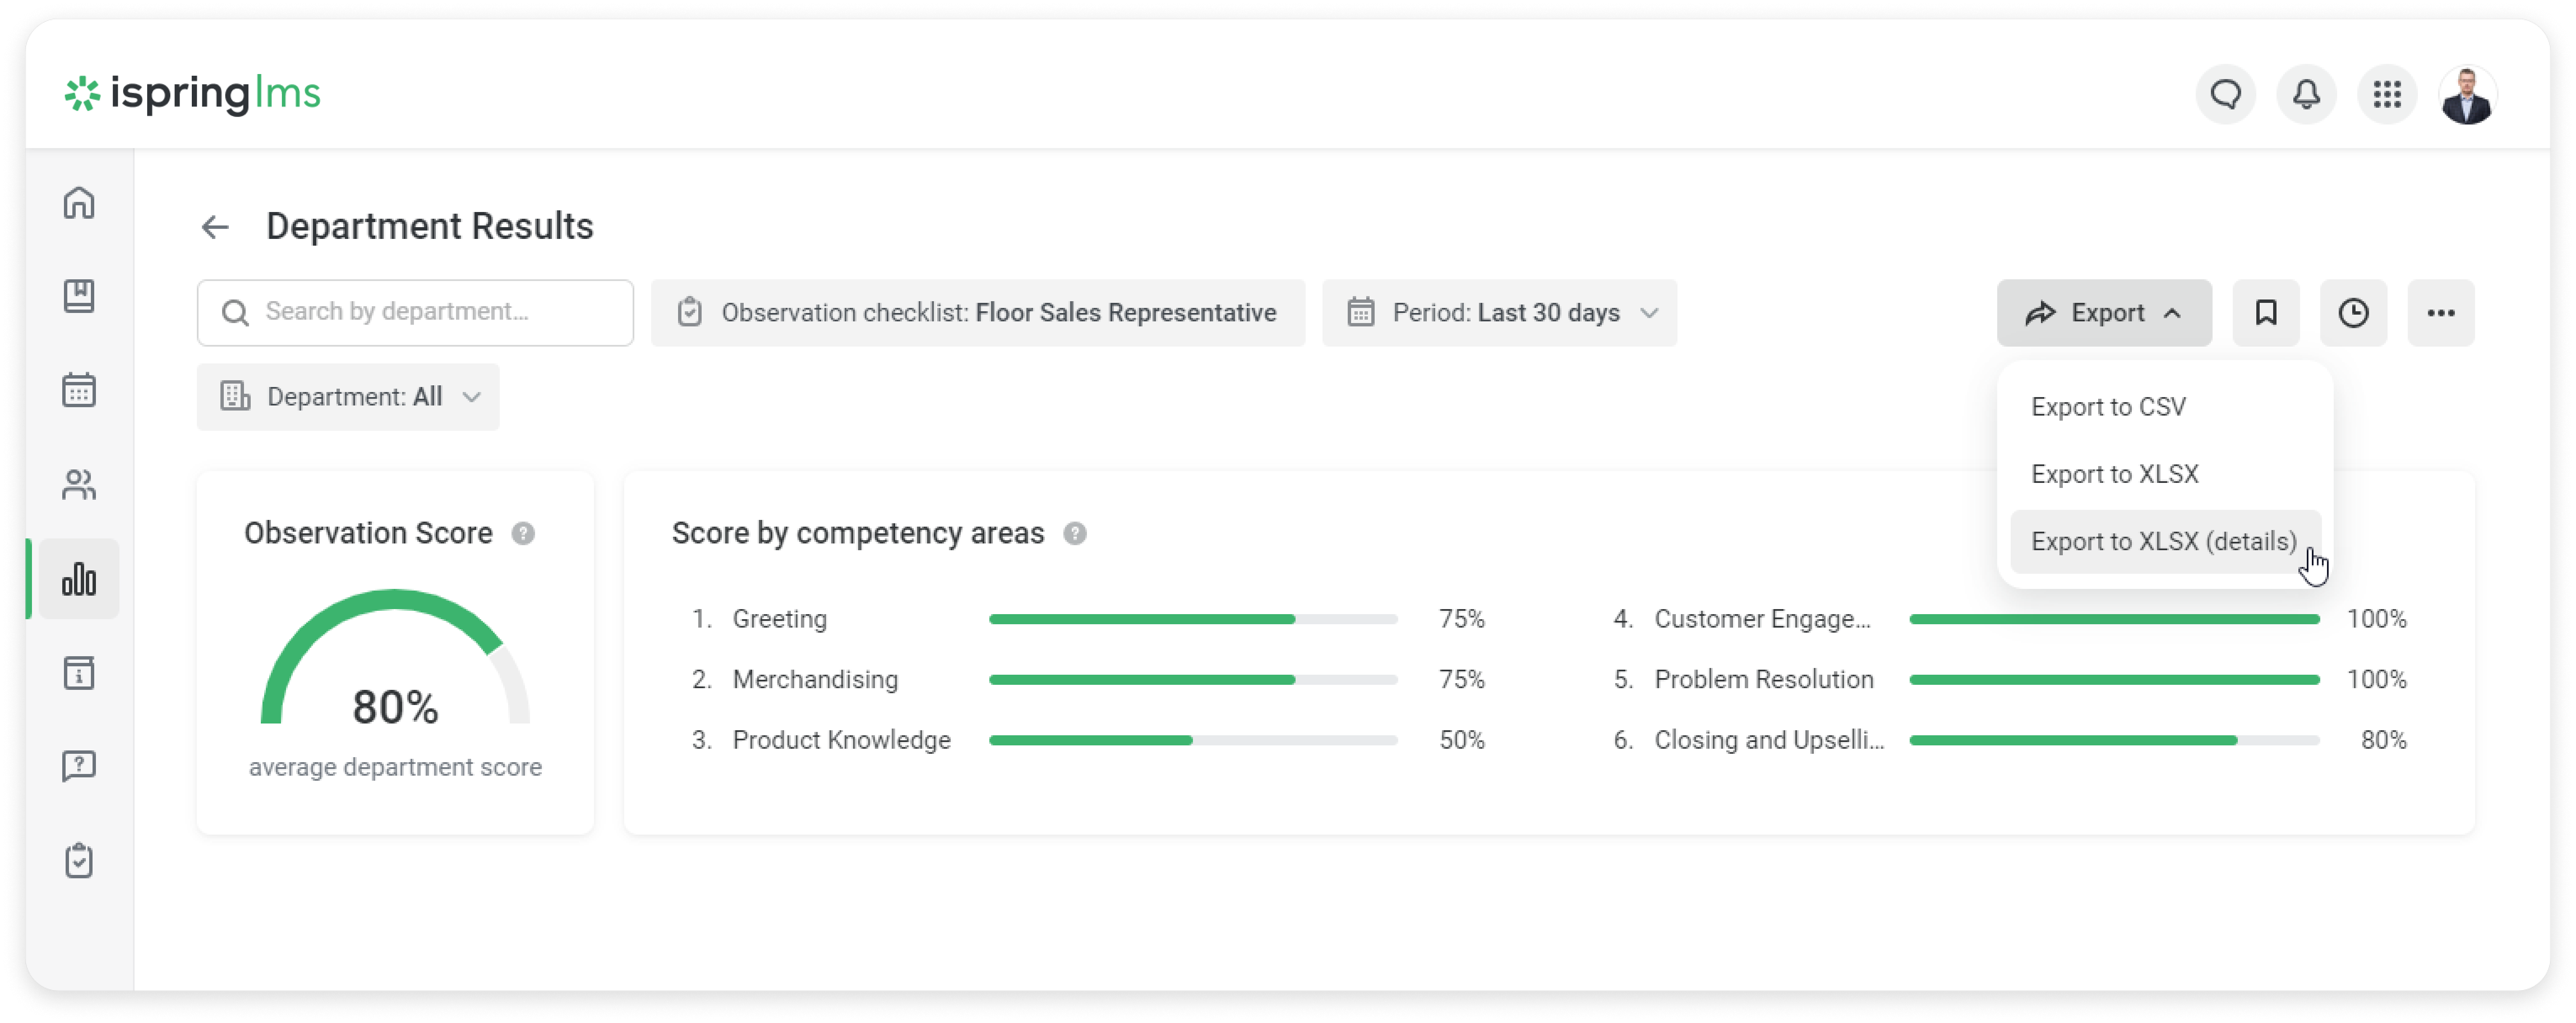
How to Export a Report
From the report, you can set up a detailed export file for each session. This will allow you to find out what criteria the employees fall into. This will help identify areas for development and plan additional training on those skills.
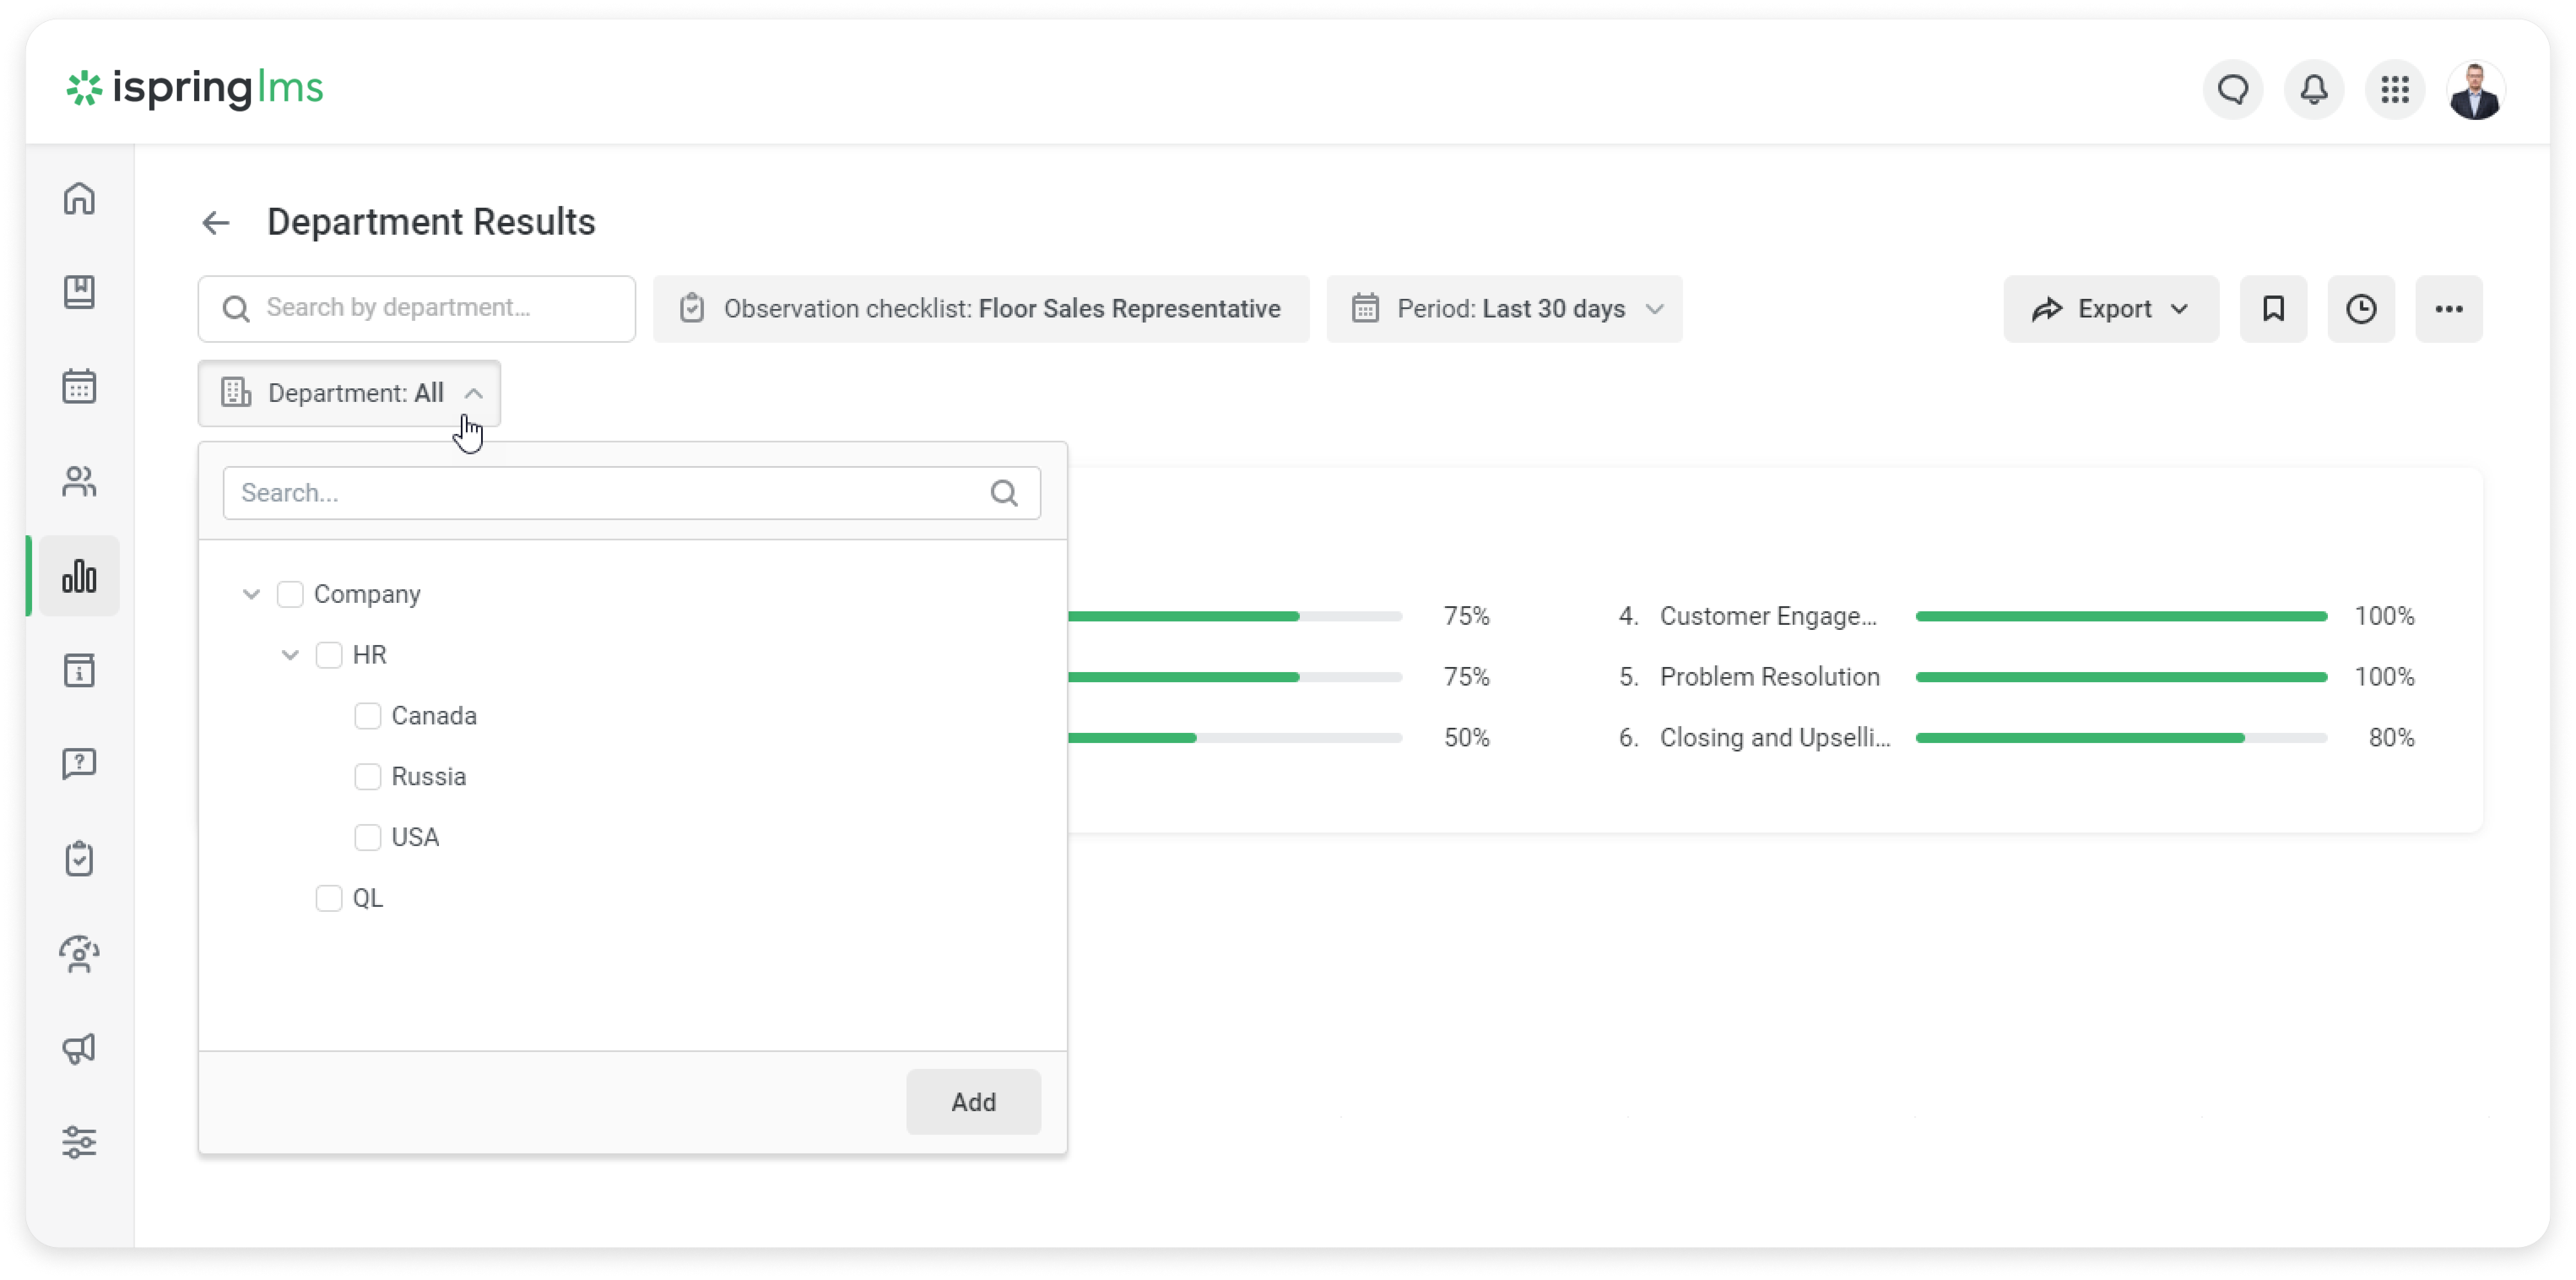
Filters and Sorting
Use the filters and sorting functionalities. For example, when you want to compare the performance of different departments, sort the report by department.