AVAILABLE WITH BUSINESS SUBSCRIPTION
You can create 2 Performance Appraisal reports in iSpring Learn:
Detailed report by employee
This report shows the scores that the employee received during one assessment session and offers analytical information on those values.
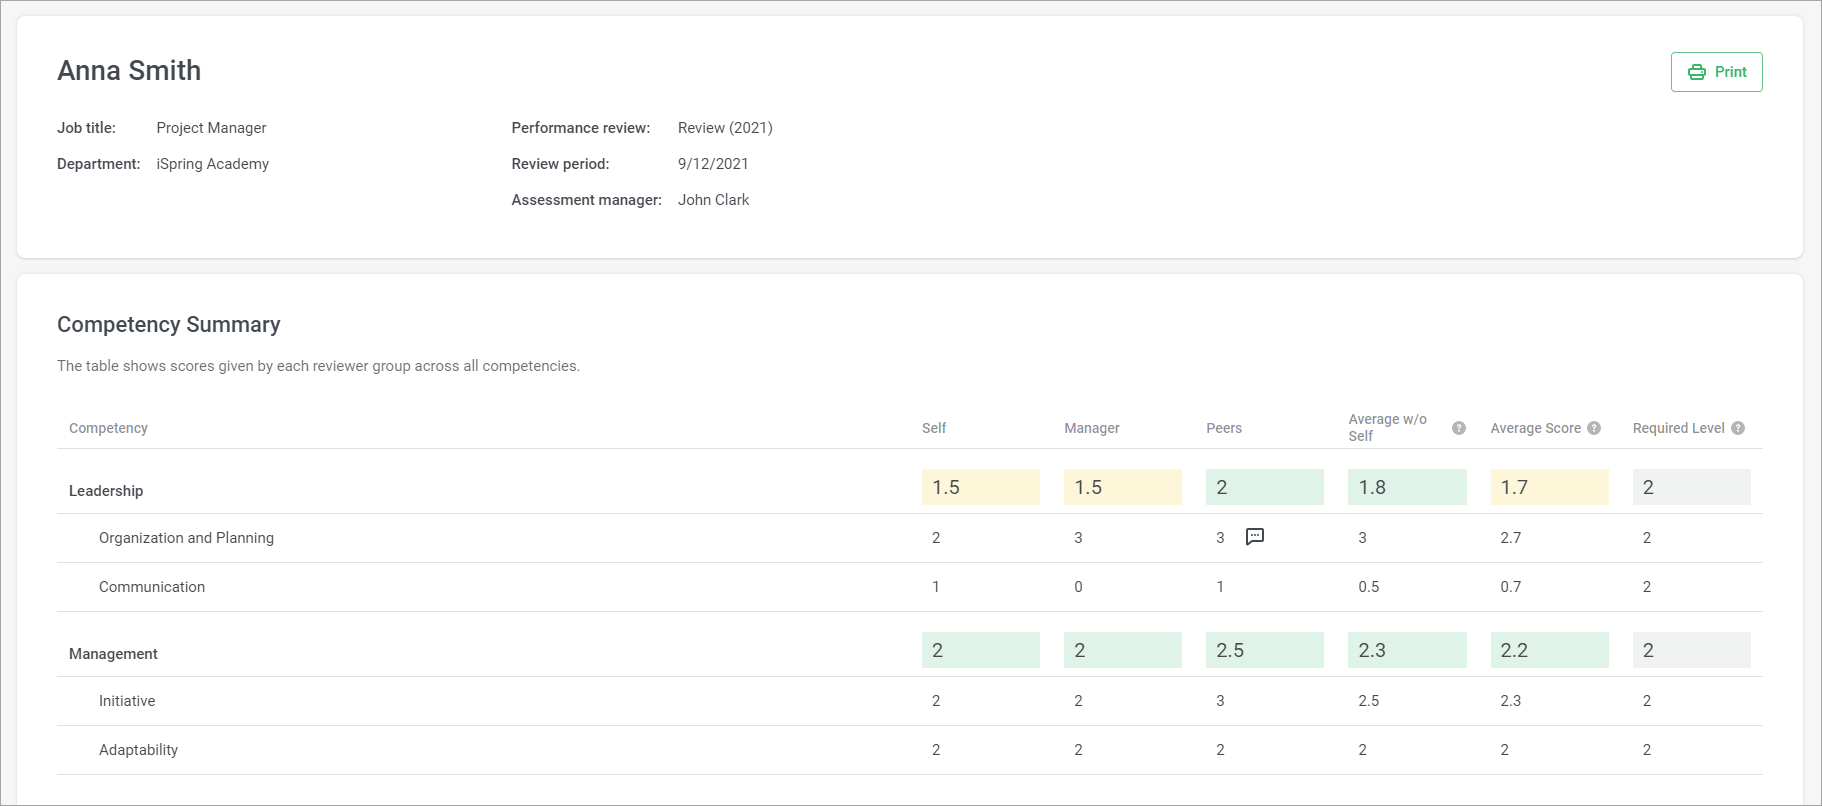
The colored fields show the percentage of the maximum score, or the required level if it has been set.
More
If you haven't set the required level, the default indicators in the table will be colored as follows:
| red | Х < 25% |
| yellow | Х < 60% |
| green | Х > 60% |
+
If you have set the required levels, the indicators in the table will be colored as follows:
| red | Х < 0.25*((score﹣min scale point value)/(max scale point value ﹣min scale point value))/0.6 |
| yellow | 0.25*((score - min scale point value)/(max scale point value﹣min scale point value))/0.6 < = X < ((user's score - min scale point value)/(max scale point value﹣min scale point value)) |
| green | X >= ((score﹣min scale point value)/(max scale point value﹣min scale point value)) |
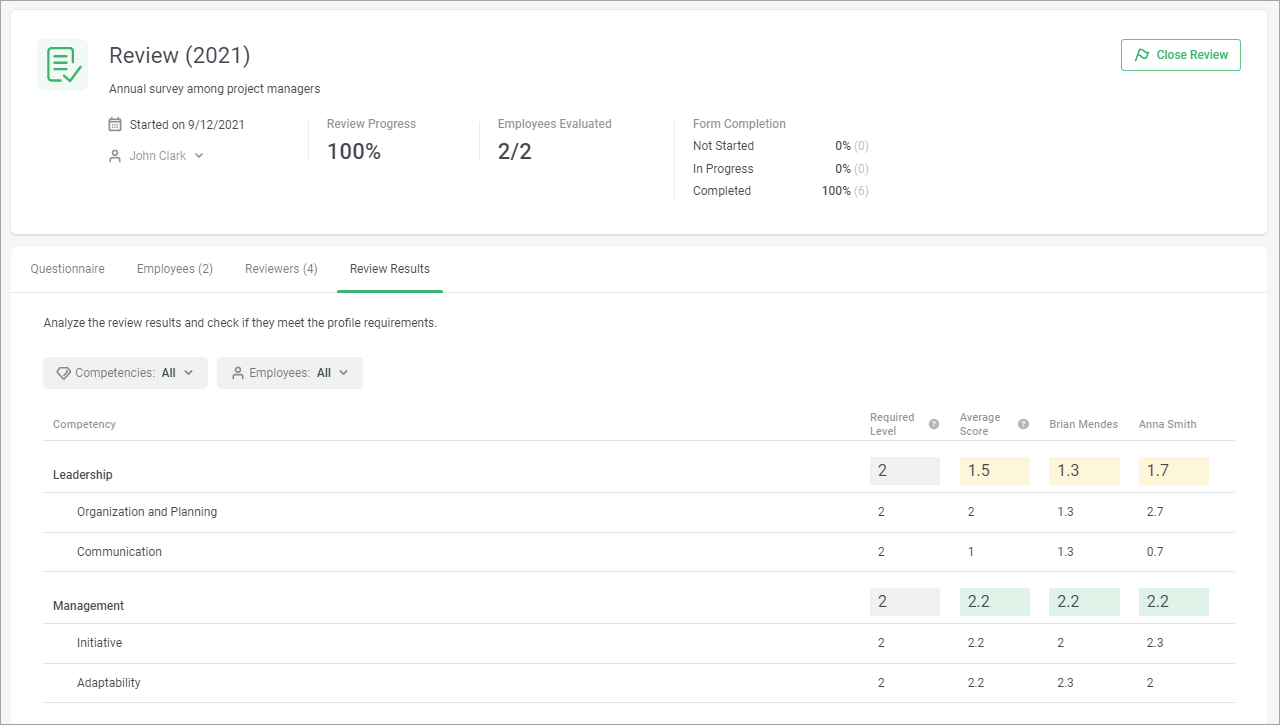
Review Results
This shows the average scores of all employees in one assessment session.
The report will help you compare the participant's score with the required values and the scores of other employees for each competency.