Quizzes, Surveys, Role-Plays
Reports on quizzes, surveys, and role-plays will help identify recurring themes and better organize training. Create a report on content items and go to more detailed statistics for a group of questions in the quiz:
Quizzes, Surveys, Role-Plays
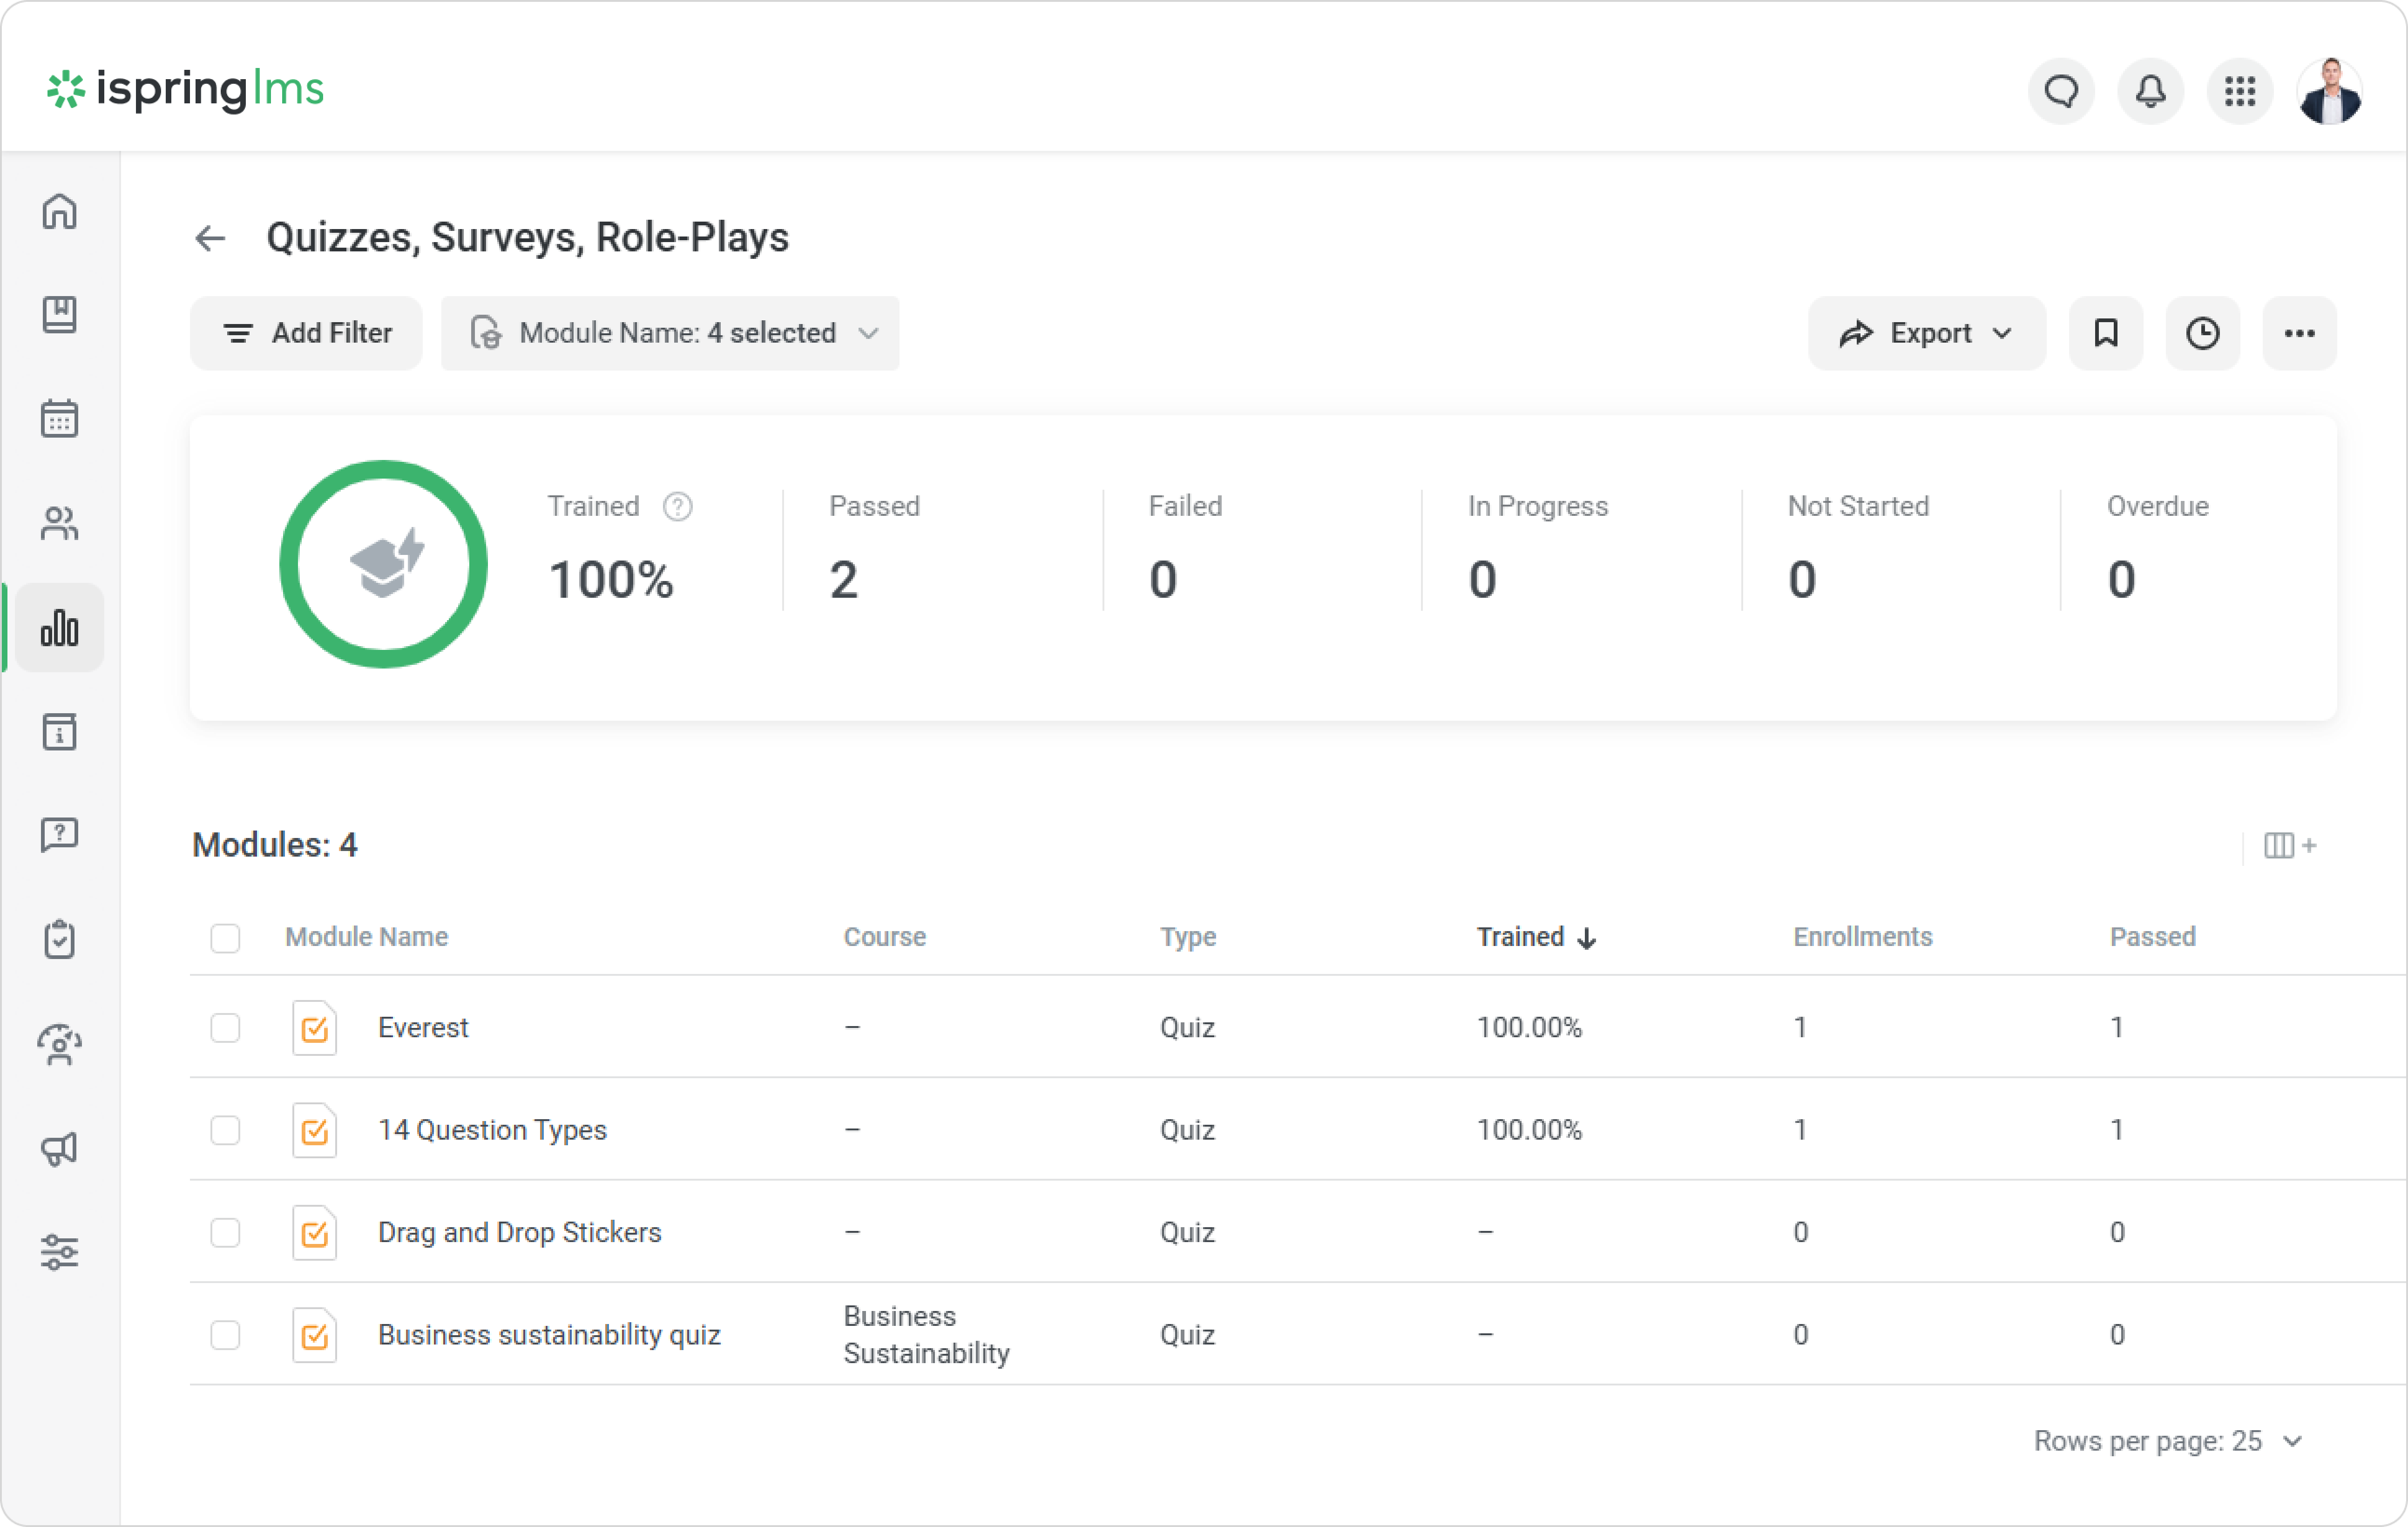
This report shows the results of passing quizzes, surveys, and role-plays created as part of a course, a standalone content item, or within a Suite course.
To create a report:
- Go to the Reports section and scroll down to the By Courses section.
Click Quizzes, Surveys, Role-Plays.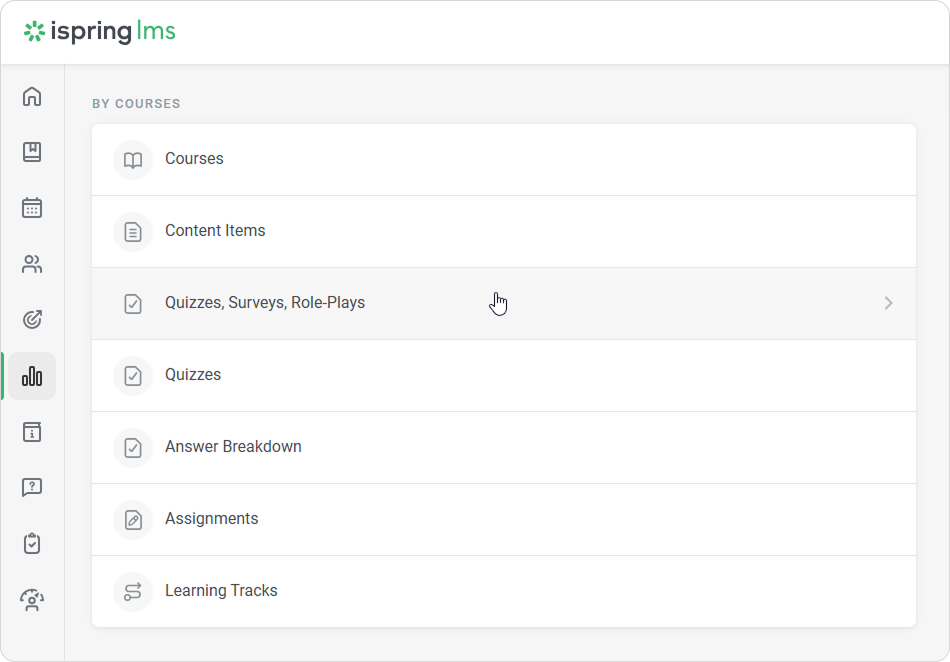
The report has been opened but is empty.
Select the content items that you want to run the report on in the Content Item filter.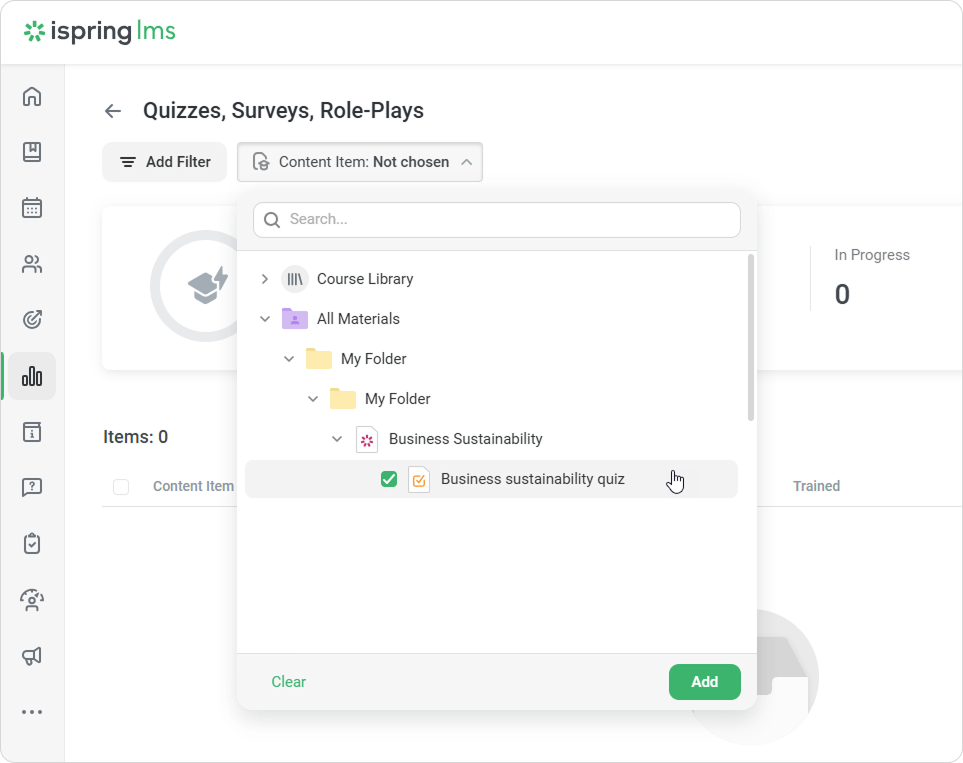
You cannot select more than 10 content items in the report.
- The report is ready now. A summary of the entire report will appear above the table with the results.
Trained | Level of students' training. To calculate this value, divide the number of completed content items by the total number of assigned content items. |
|---|---|
Completed | The number of content items that have been completed. |
| Failed | The number of content items that users didn't manage to pass. |
In Progress | The number of content items that users have started but haven't completed. |
Not Started | The number of content items that learners have not started yet. |
Overdue | The number of courses whose due dates have already expired. |
Quiz Results Overview
This report will help track the total number and percentage of correct and incorrect answers for groups of questions in the quiz.
This report only works for graded quizzes.
To run the report:
- Select a quiz in the list of content items and click the Results Overview button.
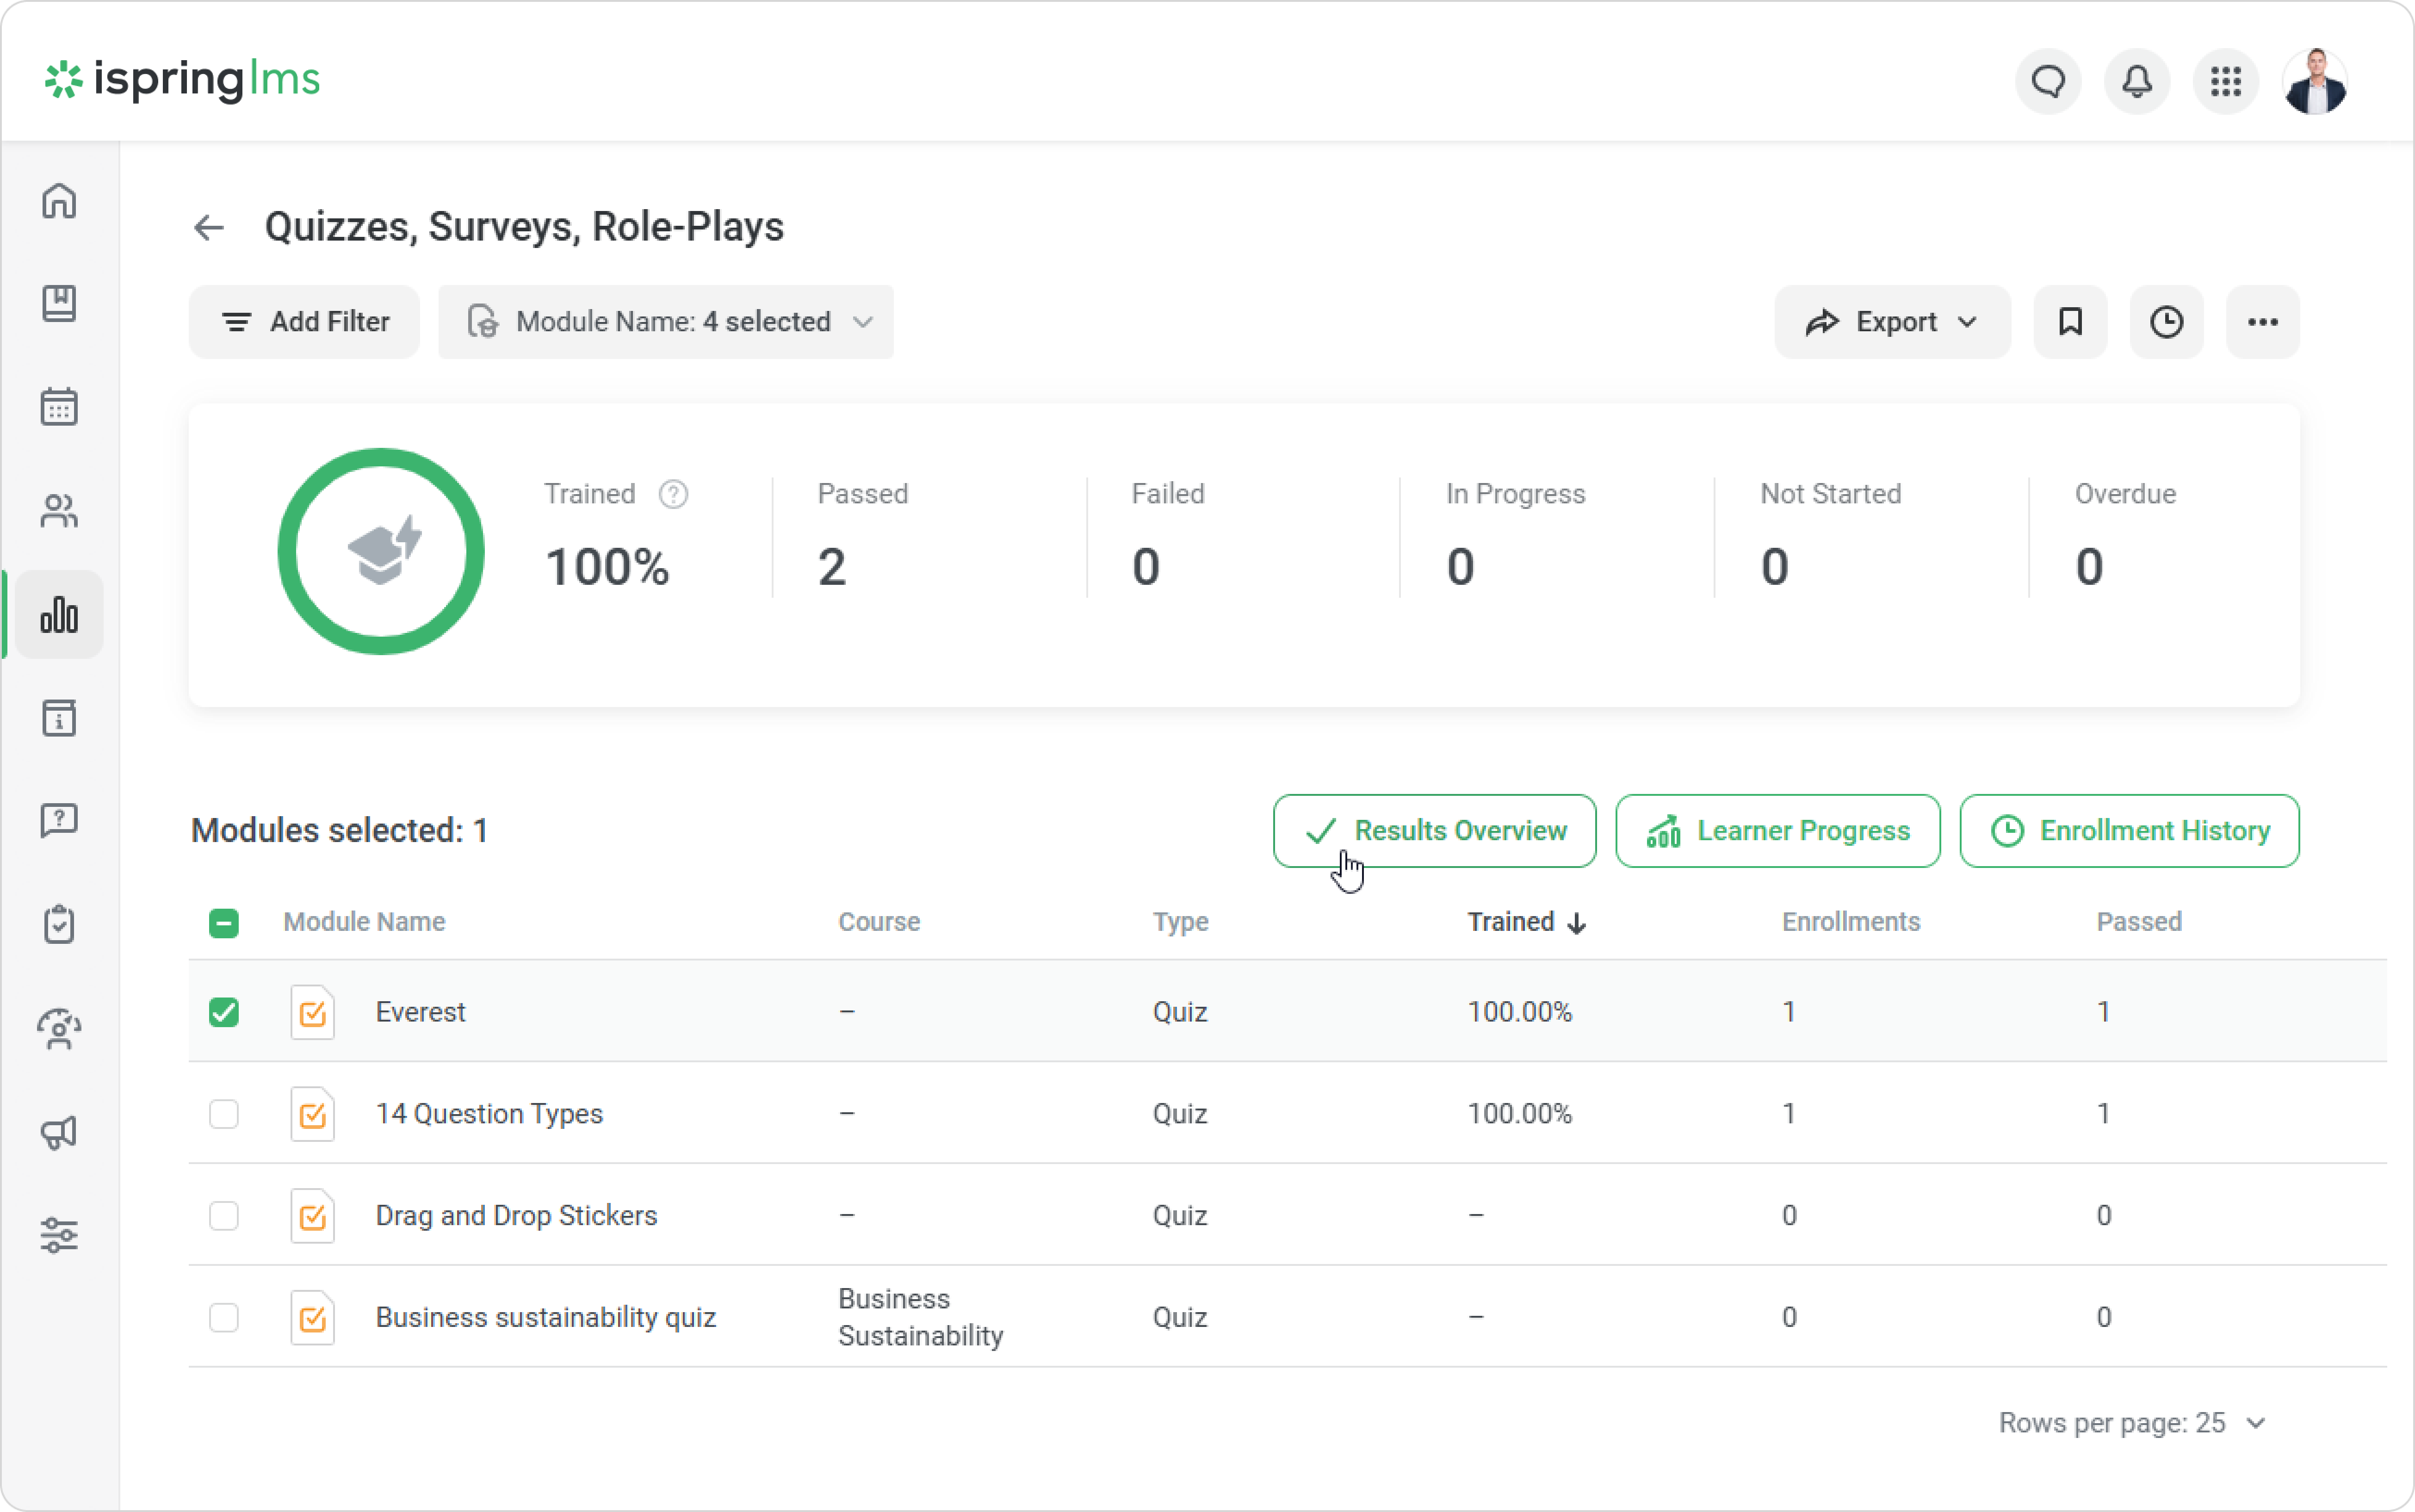
- The Quiz Results Overview report will open.
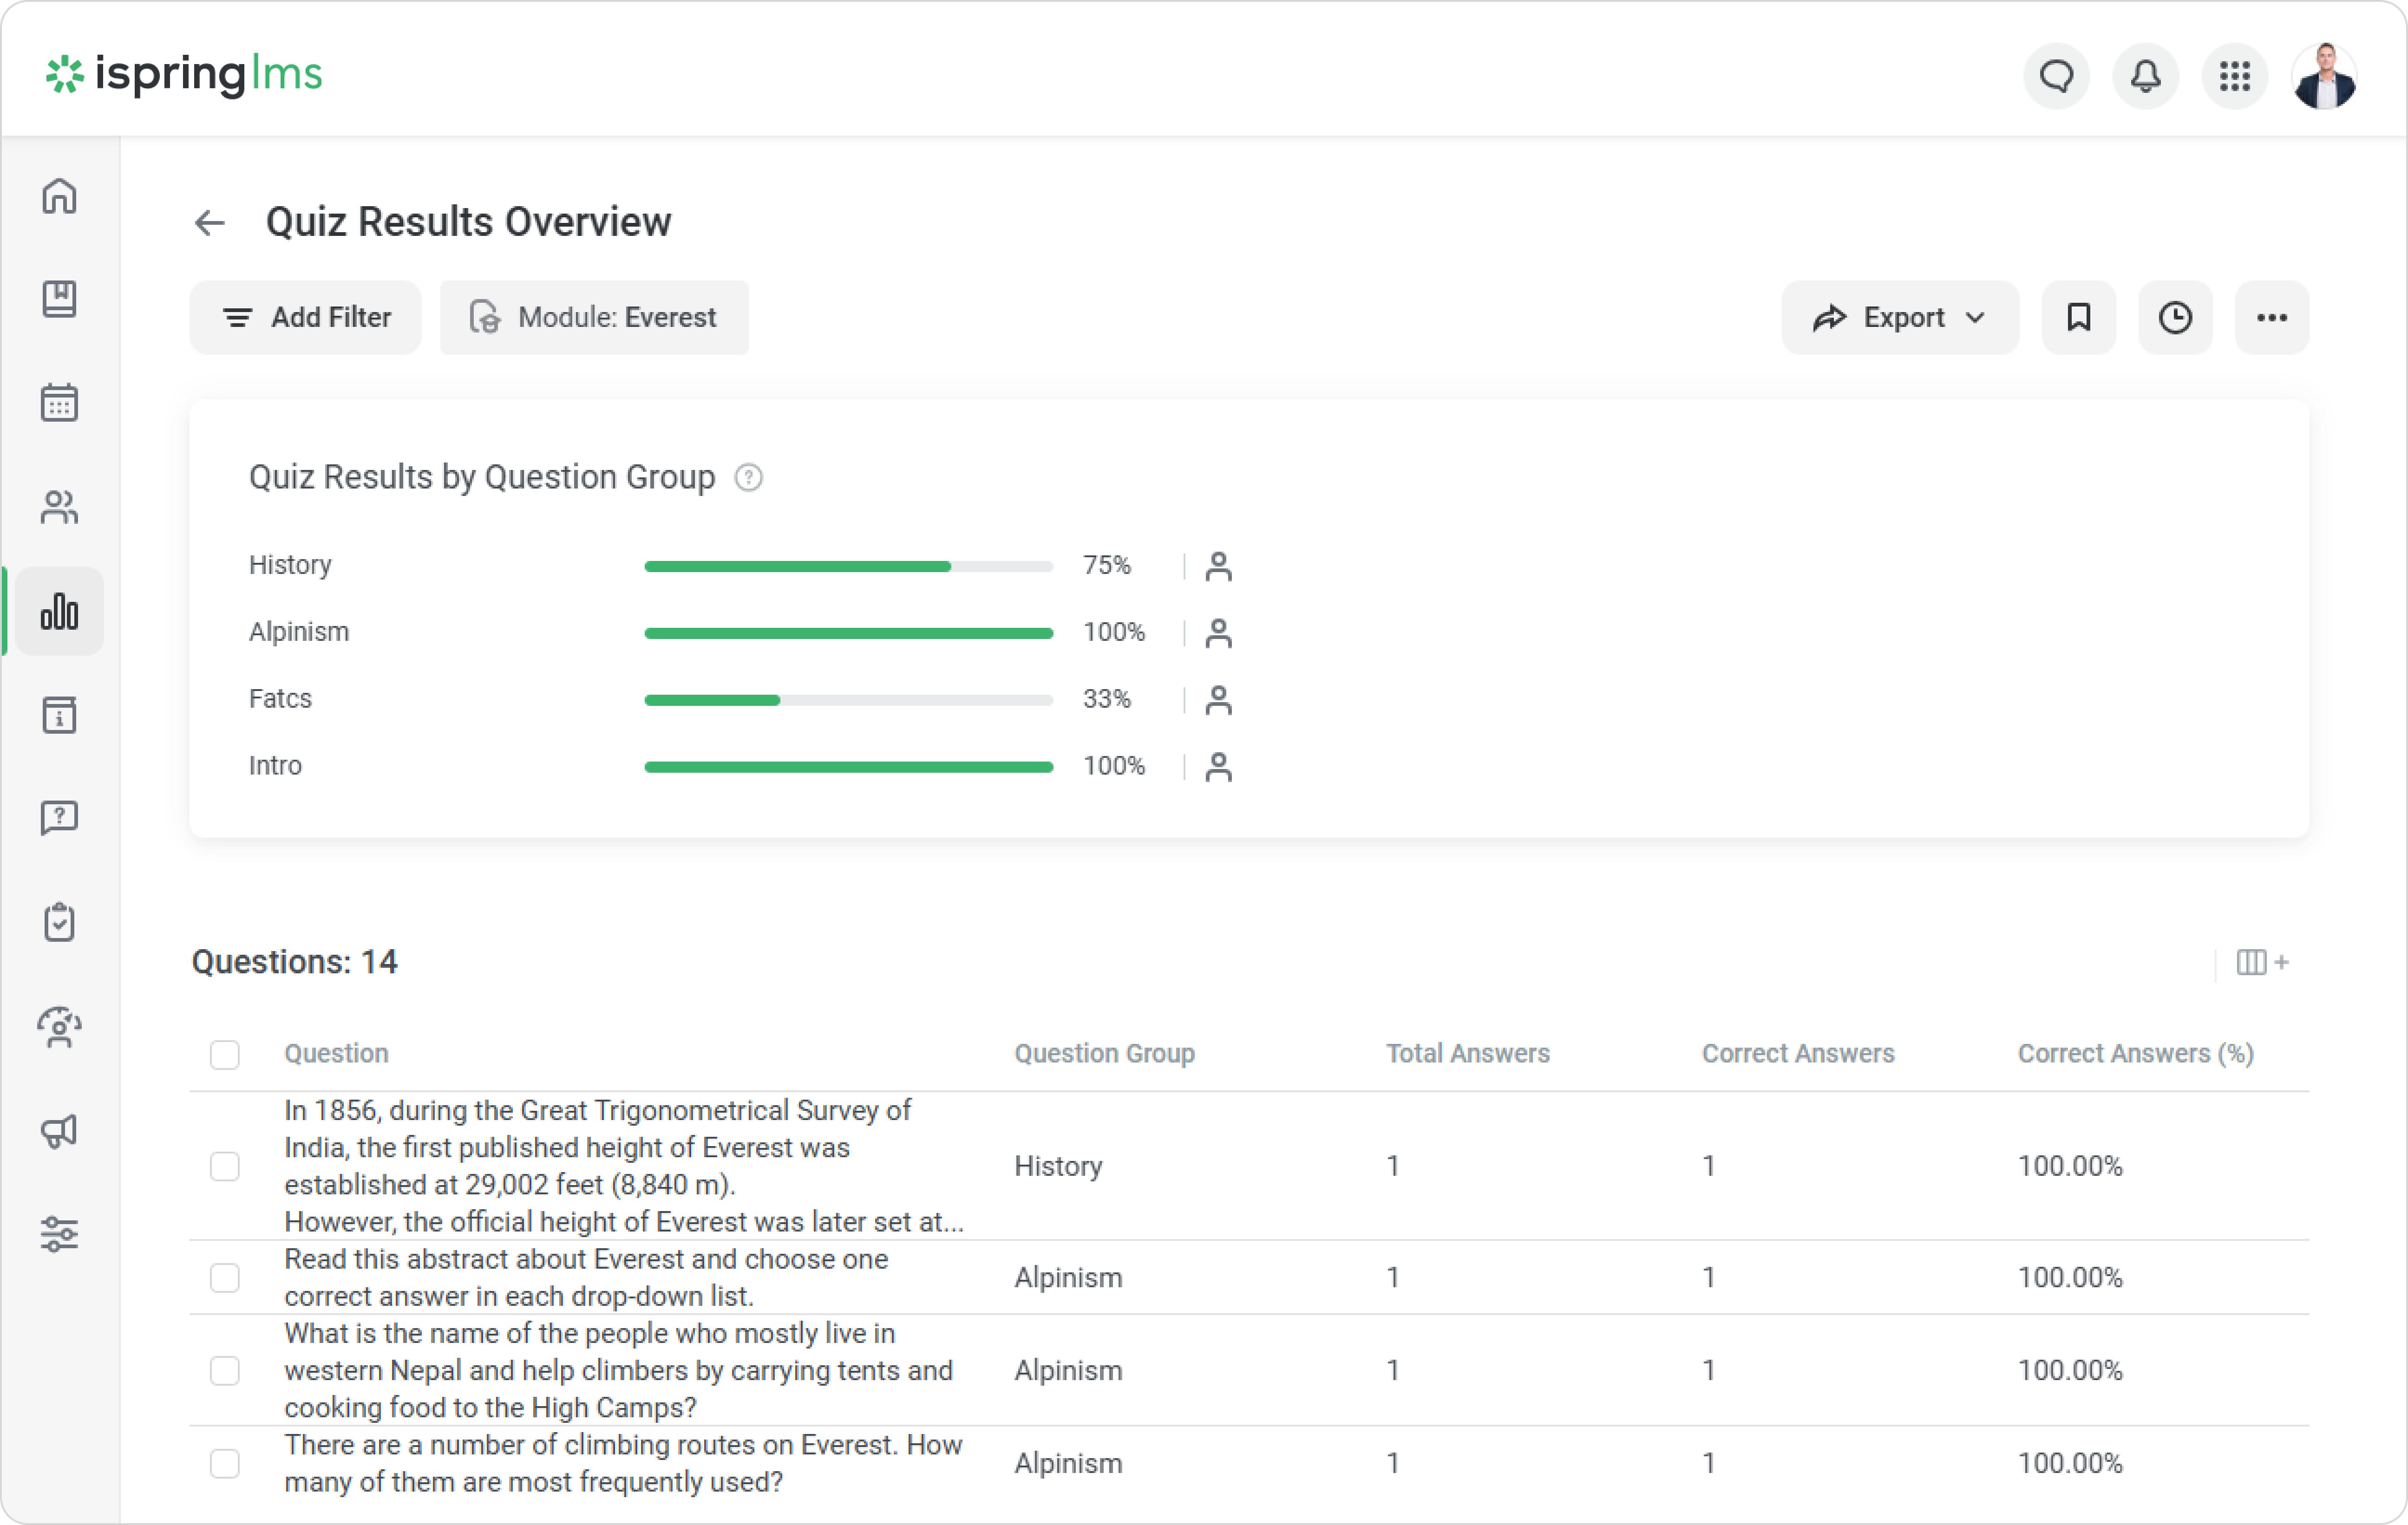
The report consists of a table and a summary for a group of questions:
- The Quiz Results by Question Group summary shows
- Titles of question groups
- Percentage of correct answers from the total number of answers in a group of questions
- The question statistics table shows:
- A list of questions
- A group of questions
- The total number and percentage of correct and incorrect answers for all employees
- The average score on each question
Important:
If the quiz contains more than 1 question group, the Question group filter appears. You can filter the report by a group of questions by clicking on the group name in the summary.
Learner Results by Question
This report helps you to see:
- If the user's answers were correct or incorrect.
- The score awarded for this question.
To run the report:
- Select a question in the list and click Learner Results by Question.
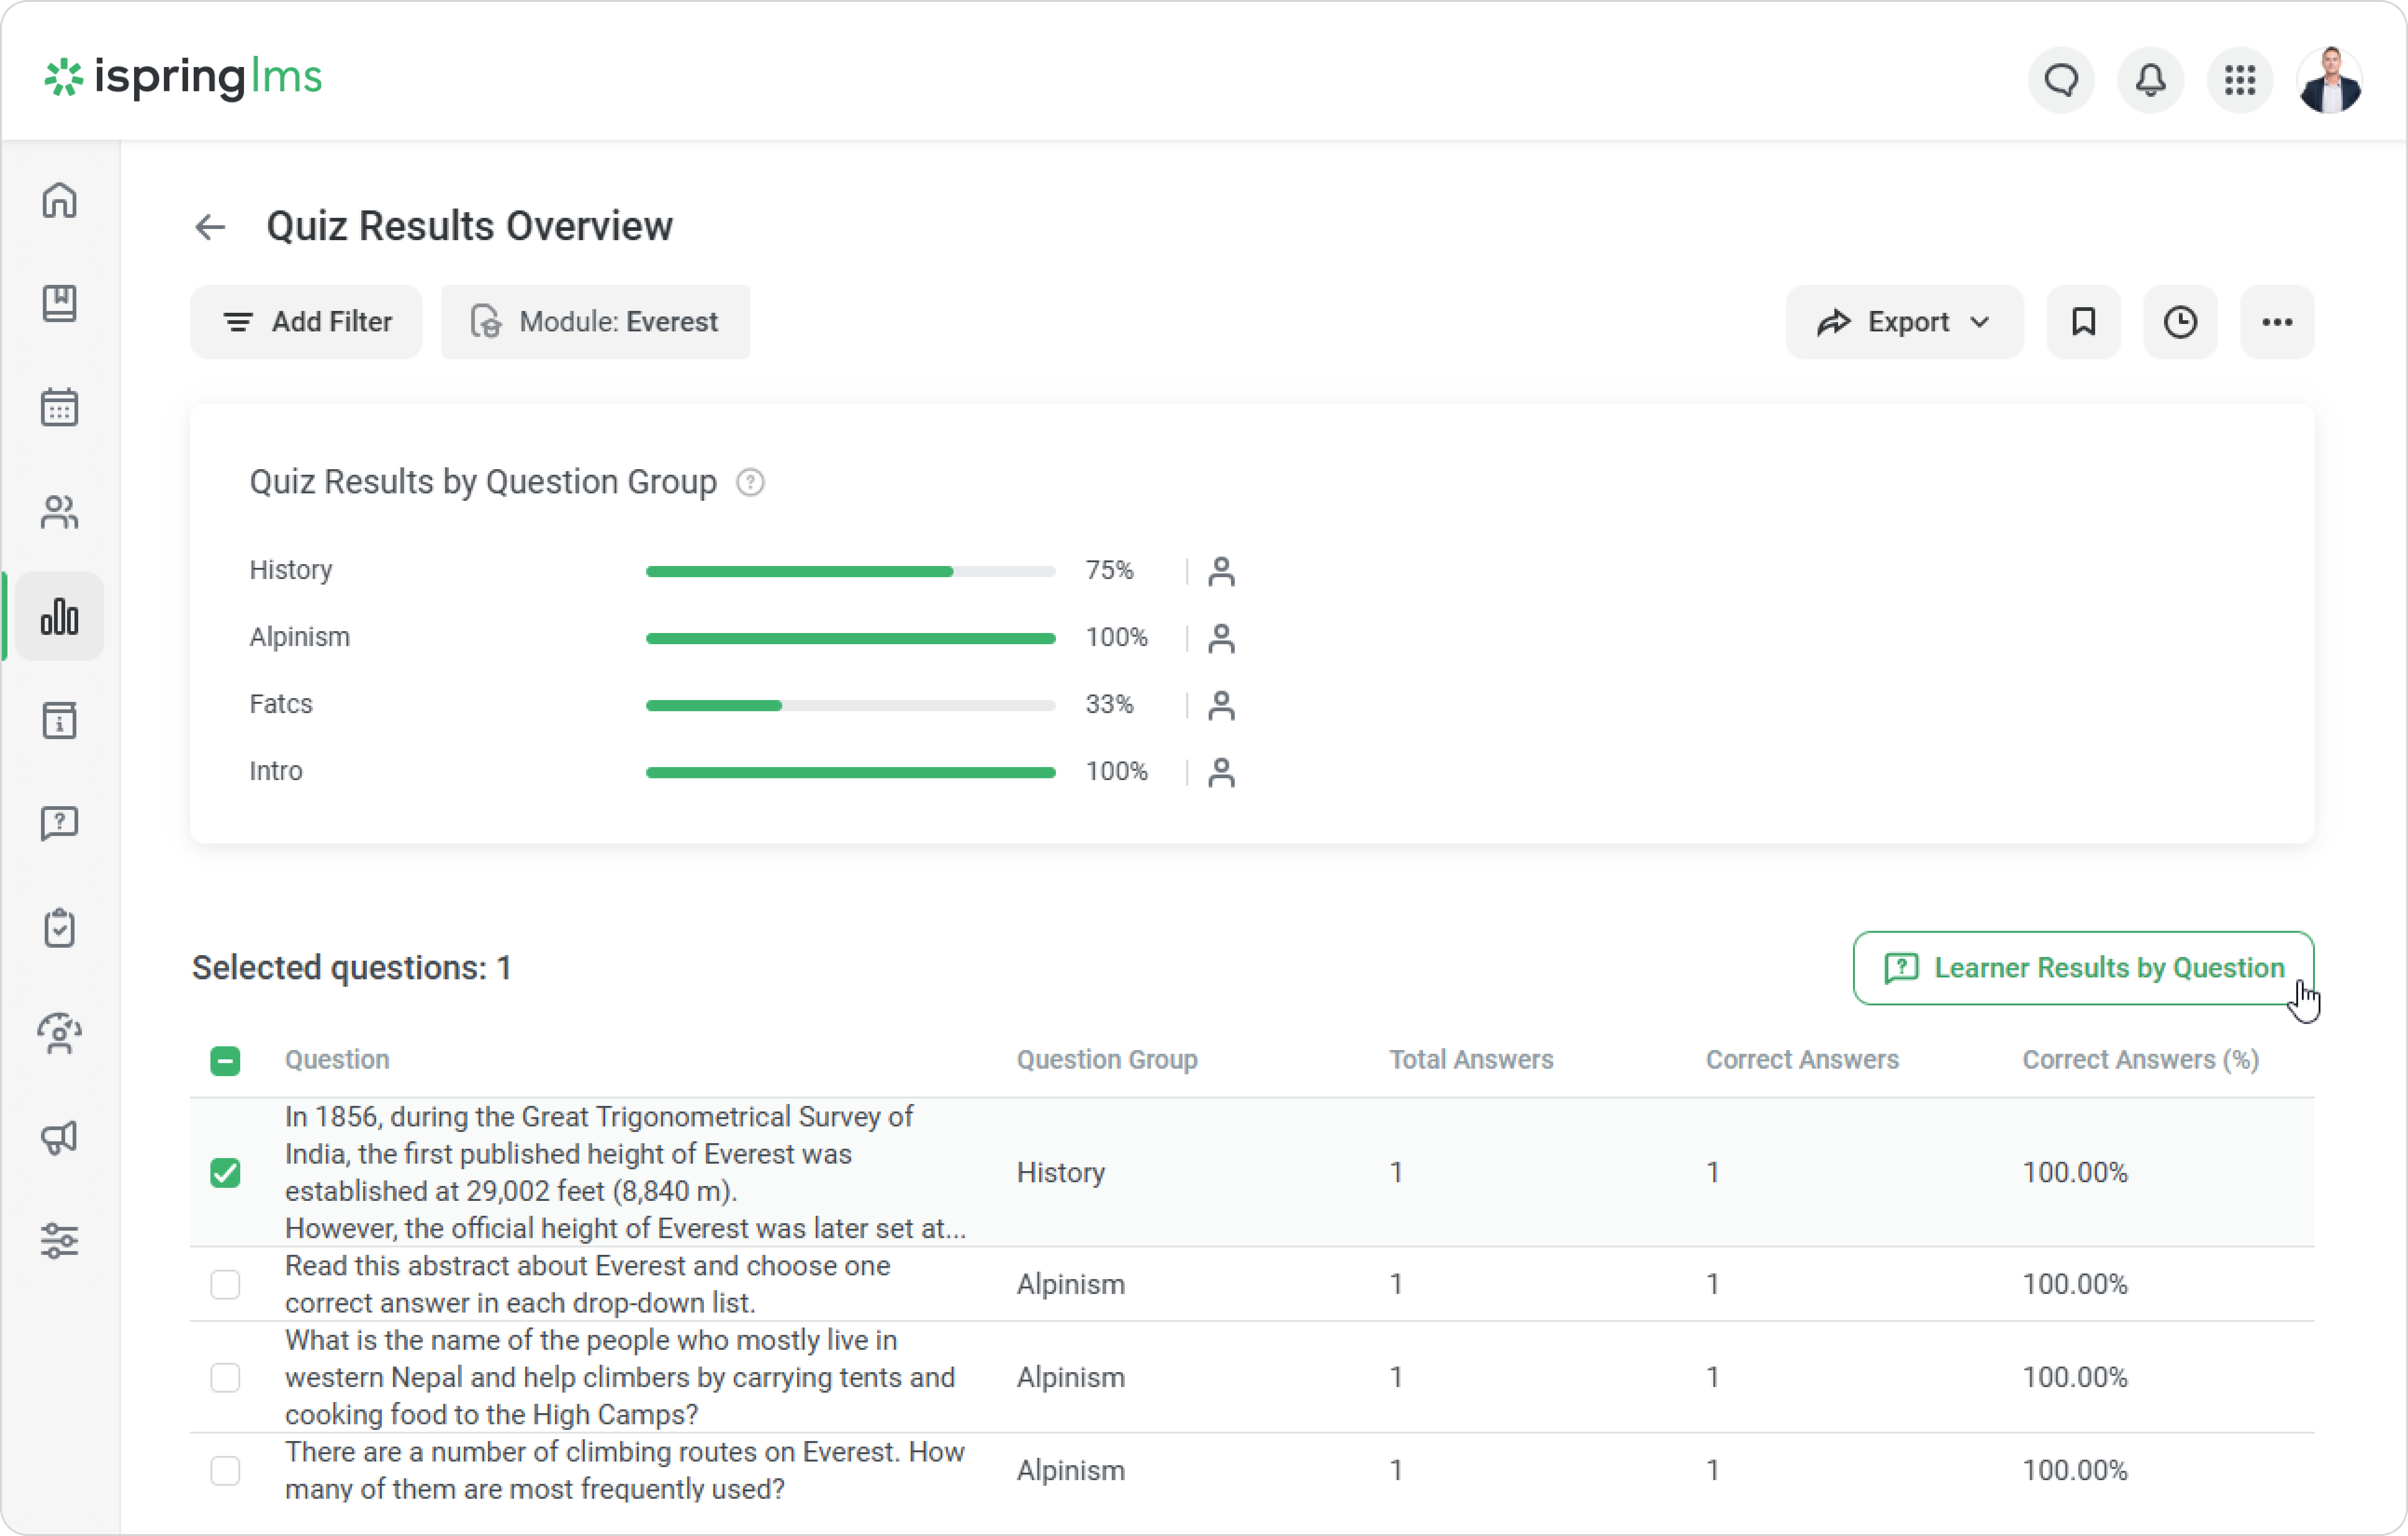
- The Learner Results by Question report will open.
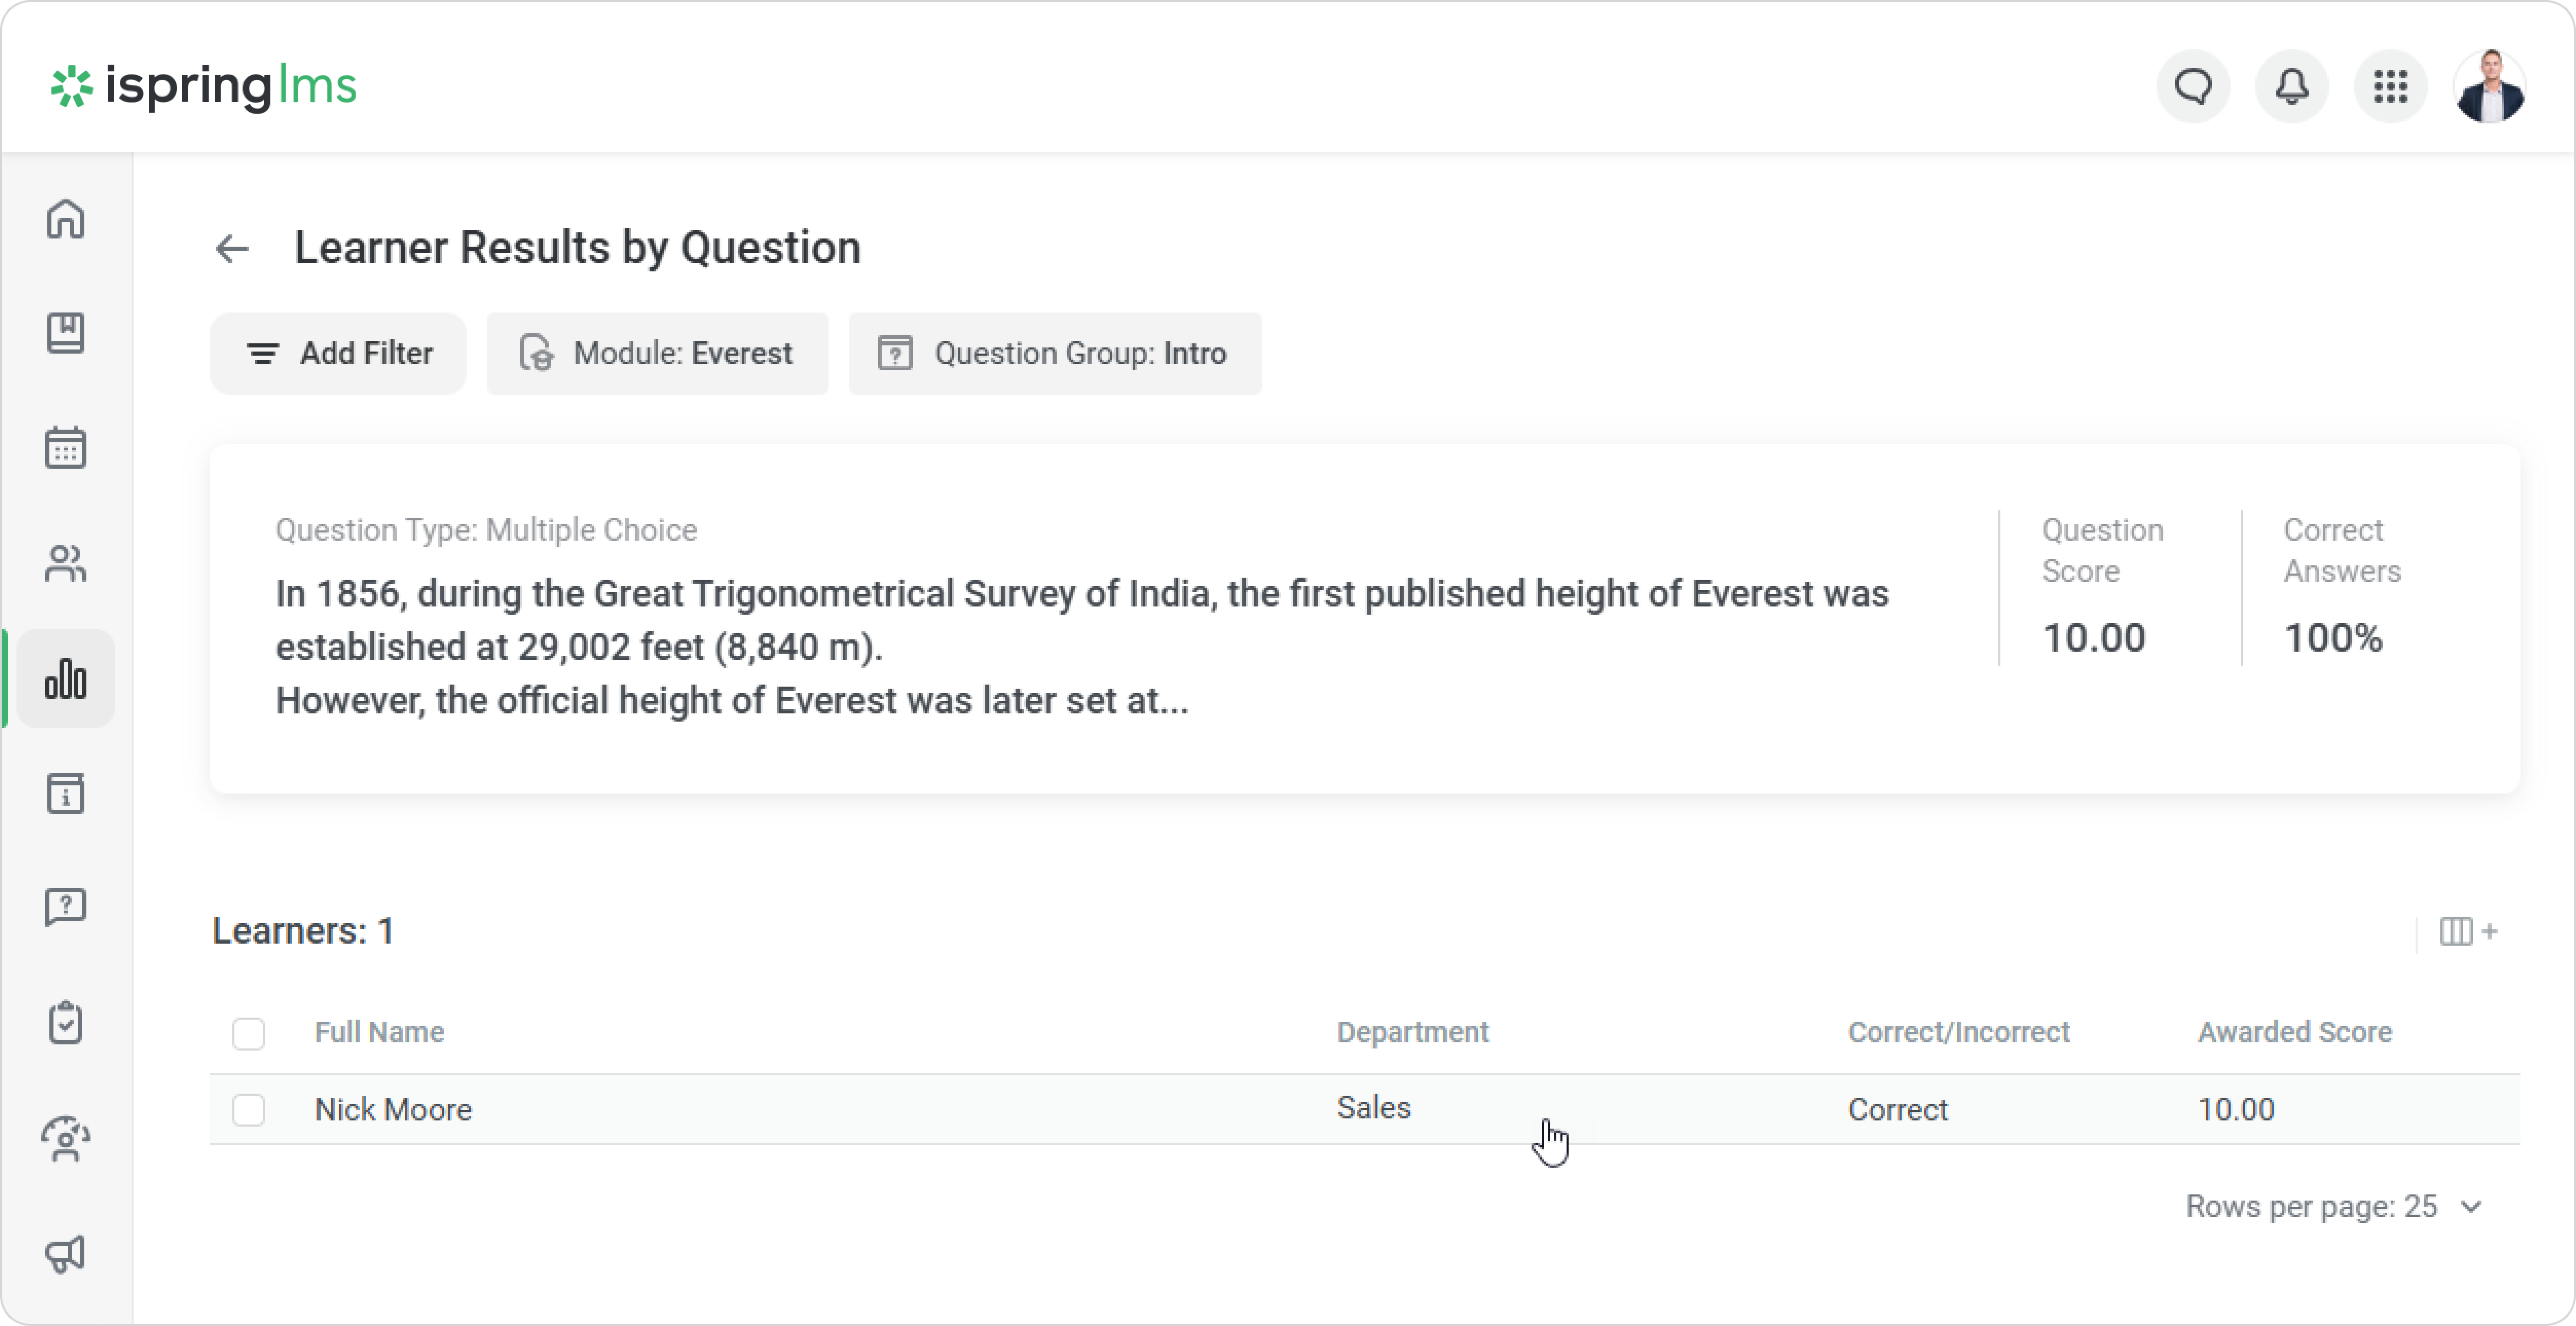
Important:
- If a question contains an equation, the Account Administrator will see the text of the question and the equation.
- For Essays and Likert scale questions, you will see the Answered column instead of the Correct/Incorrect column.
